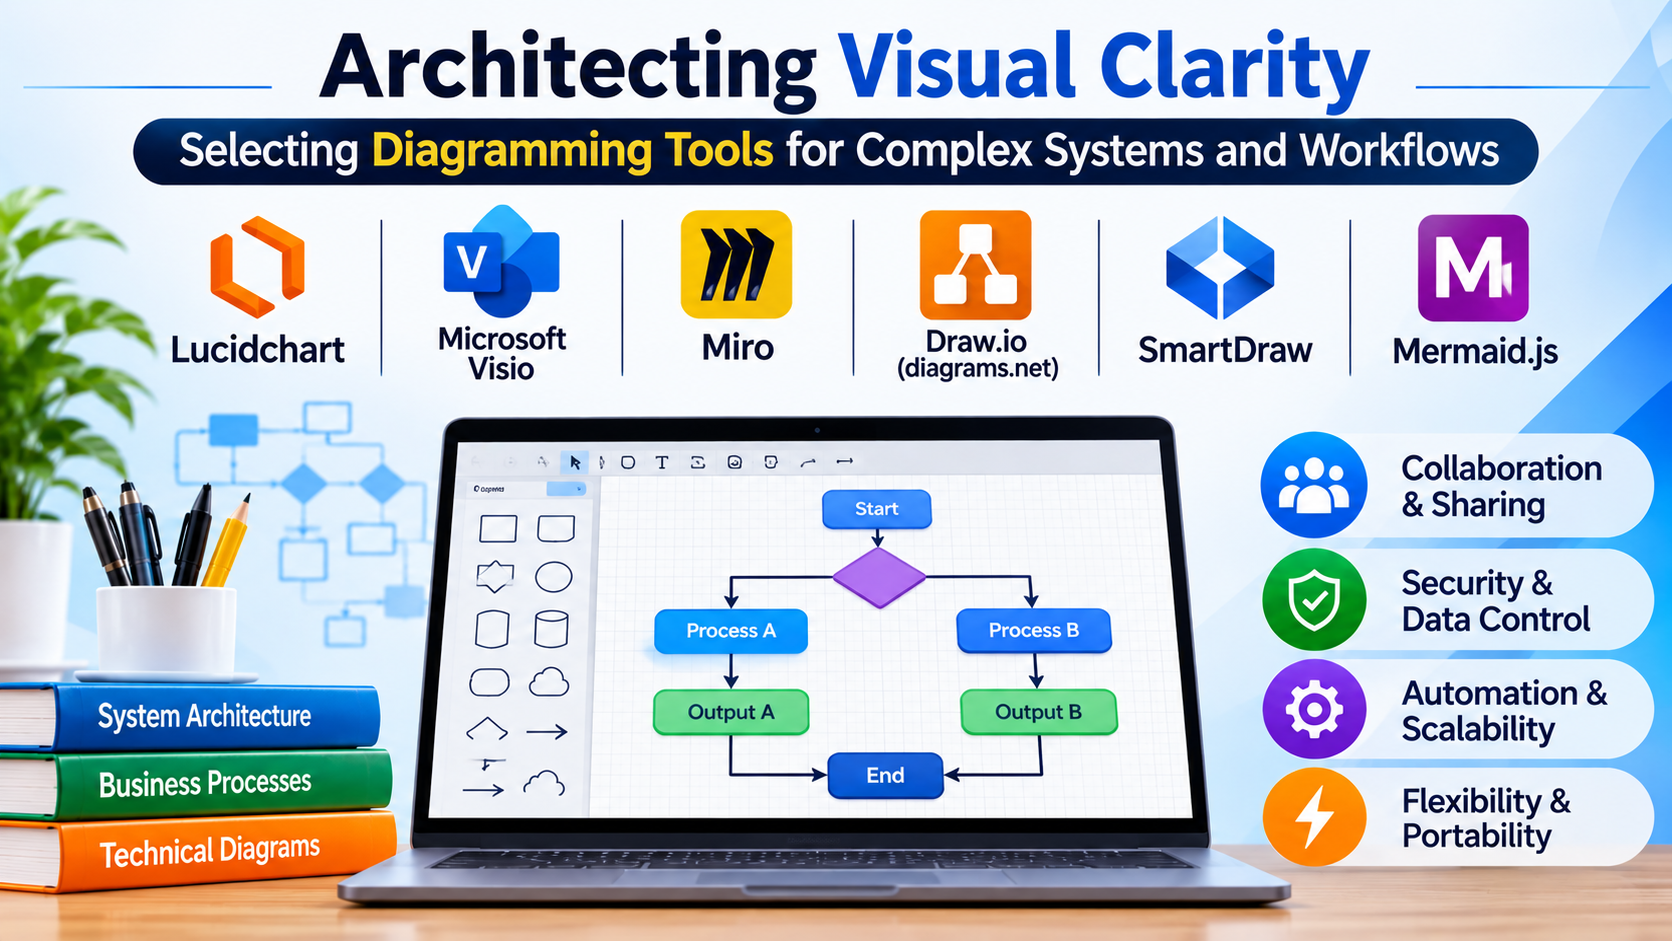
Translating abstract system architectures, data flows, and organizational processes into precise visual models requires more than a blank canvas and a library of basic geometric shapes. While casual brainstorming boards serve rapid ideation, documenting enterprise cloud infrastructure, software deployment pipelines, or regulatory compliance pathways demands rigorous visual syntax, automated layout engines, and precise notation standards.
Choosing the right diagramming platform depends heavily on whether your primary objective is rapid collaborative whiteboarding, precise engineering schematic generation, or code-driven diagram maintenance.
The Divergence in Modern Diagramming Paradigms
The diagramming software ecosystem has evolved into several distinct technical approaches, each optimized for specific engineering and business workflows:
- Freeform Visual Workspaces: Built for collaborative brainstorming, agile sprint planning, and high-level concept mapping. These tools prioritize infinite canvases, sticky notes, and frictionless multi-user commenting over strict structural rules.
- Structured Vector and Shape Libraries: Designed for business process modeling (BPMN), network topologies, and UML diagrams. These applications offer snap-to-grid precision, strict stencil libraries, and comprehensive export options for technical documentation.
- Diagram-as-Code Frameworks: Tailored for software architects and DevOps engineers, these platforms generate visual charts directly from plain-text definitions, markdown scripts, or domain-specific languages (DSLs), enabling seamless version control integration via Git.
Understanding where your project requirements intersect with these paradigms prevents architectural drift and mismatched tooling during critical project phases.
Leading Diagramming Platforms and Technical Differentiators
1. Lucidchart
Lucidchart stands as a dominant cloud-based, general-purpose diagramming platform used widely across enterprise engineering, IT operations, and business analysis teams.
- Primary Use Case: Cloud architecture mapping, cross-functional business process flows, and database entity-relationship modeling.
- Key Differentiators: Extensive shape libraries spanning AWS, Azure, and GCP; robust data-linking capabilities that dynamically update shapes based on live external data sources; and seamless real-time collaboration.
- Limitations: Subscription costs scale with team size; complex enterprise governance and security features are restricted to higher-tier plans.
- Best Suited For: Enterprise teams requiring structured technical diagrams alongside collaborative business process mapping.
2. Microsoft Visio
As a long-standing standard in enterprise environments, Microsoft Visio provides deep integration with corporate infrastructures already anchored in the Microsoft ecosystem.
- Primary Use Case: Detailed IT network topologies, engineering schematics, and corporate organizational charts.
- Key Differentiators: Professional stencils for building blueprints and floor plans, native integration with Microsoft 365, Excel data-linking capabilities, and robust compliance features.
- Limitations: Steeper learning curve for non-technical users; licensing costs can be high compared to web-native alternatives.
- Best Suited For: Organizations deeply invested in Windows and Microsoft 365 infrastructures requiring advanced technical stencil accuracy.
3. Miro
While primarily positioned as a digital whiteboarding workspace, Miro has evolved into a comprehensive visual collaboration hub adopted across product and engineering lifecycles.
- Primary Use Case: Agile retrospective sessions, user story mapping, and high-level system ideation workshops.
- Key Differentiators: Infinite canvas fluidity, extensive template ecosystems, robust facilitation tools (timers, voting, cursor tracking), and deep integrations with project management suites like Jira and GitHub.
- Limitations: Less suited for strict engineering schematics requiring precise connection routing and standardized notation enforcement.
- Best Suited For: Cross-functional product teams, remote design squads, and agile engineering groups focusing on collaborative planning.
4. Draw.io (diagrams.net)
Draw.io provides an entirely open-source, highly secure diagramming solution that can operate completely offline or integrate seamlessly into existing document repositories.
- Primary Use Case: Secure enterprise documentation, local-first network mapping, and budget-conscious technical drawing.
- Key Differentiators: Completely free core application with no forced cloud account creation; strict local storage options ensuring zero data leakage; and deep native integrations with Confluence and GitHub.
- Limitations: Interface lacks the polished modern aesthetics of commercial SaaS competitors; advanced collaboration features require third-party platform integration.
- Best Suited For: Security-conscious organizations, government entities, and open-source development teams requiring complete data sovereignty.
5. SmartDraw
SmartDraw bridges the gap between basic drag-and-drop drawing and automated formatting, making it an efficient choice for creating large volumes of business graphics.
- Primary Use Case: Rapid business flowcharting, organizational mapping, and automated structural layouts.
- Key Differentiators: Built-in intelligent formatting engine that automatically aligns and spaces shapes as you add or delete content, along with extensive enterprise integrations.
- Limitations: Requires an active subscription for full feature access and cloud synchronization.
- Best Suited For: Business analysts and project managers who need to generate clean, professional diagrams quickly without manual alignment work.
6. Mermaid.js
Mermaid represents the standard bearer for diagram-as-code tooling, allowing authors to render complex diagrams dynamically using plain text and markdown-friendly syntax.
- Primary Use Case: Automated documentation generation, README architecture files, and software sequence modeling within version control.
- Key Differentiators: Completely text-based workflow eliminating manual shape positioning; native rendering inside GitHub, GitLab, and Notion; perfect integration with CI/CD documentation pipelines.
- Limitations: Steep learning curve for non-technical stakeholders; visual styling customization is constrained compared to dedicated vector editors.
- Best Suited For: Software engineers, technical writers, and DevOps teams managing documentation-as-code repositories.
Feature Comparison Matrix
| Product | Primary Focus | Deployment Model | Syntax Style | Significant Advantage | Important Limitation |
| Lucidchart | Structured Technical & Business Diagrams | Cloud (SaaS) | Graphical Drag-and-Drop | Live data-linking and deep cloud stencils | Subscription required for advanced features |
| Microsoft Visio | Enterprise IT & Engineering Schematics | Desktop & Cloud | Graphical Drag-and-Drop | Deep Microsoft 365 integration and professional stencils | Steeper learning curve and higher cost |
| Miro | Collaborative Ideation & Agile Planning | Cloud (SaaS) | Infinite Whiteboard | Exceptional remote workshop facilitation | Less suited for strict engineering schematics |
| Draw.io | Secure & Open-Source Diagramming | Desktop / Cloud Hybrid | Graphical Drag-and-Drop | Complete data privacy and zero licensing cost | Basic interface and manual collaboration setup |
| SmartDraw | Rapid Business & Process Mapping | Cloud & Desktop | Automated Layout Drag-and-Drop | Intelligent formatting and auto-alignment | Paid subscription model required |
| Mermaid.js | Diagram-as-Code & Documentation | Open-Source Library | Plain-Text DSL | Version-controlled diagrams via Git | Requires text-syntax fluency |
Evaluating Technical and Operational Trade-Offs
Selecting a diagramming solution involves balancing administrative overhead against technical flexibility:
- Version Control and Auditability: Binary file formats obscure diff histories in code repositories. Adopting text-based diagramming approaches ensures that architectural changes can be tracked, reviewed, and merged with the same rigor as source code.
- Data Governance and Security Boundaries: Enterprise organizations handling sensitive intellectual property or regulated data must evaluate whether vendor cloud storage complies with internal compliance policies, often necessitating local-first or self-hosted deployment models.
- Maintenance Overhead: Manually drawn diagrams inevitably drift from actual system architecture over time. Utilizing data-driven diagramming or code generation minimizes documentation decay by reflecting live infrastructure states.
Making Your Decision
The optimal diagramming tool aligns directly with your team’s core deliverables. If your work involves collaborative brainstorming and rapid agile alignment, an infinite-canvas whiteboarding workspace delivers maximum speed. For structured cloud infrastructure mapping and standardized business workflows, a dedicated vector application or an automated enterprise drafting tool is essential. Software engineering teams prioritizing maintainable documentation will find immense value in text-driven diagramming pipelines. Evaluate your security requirements, collaboration style, and maintenance capacity before standardizing your visualization stack.
