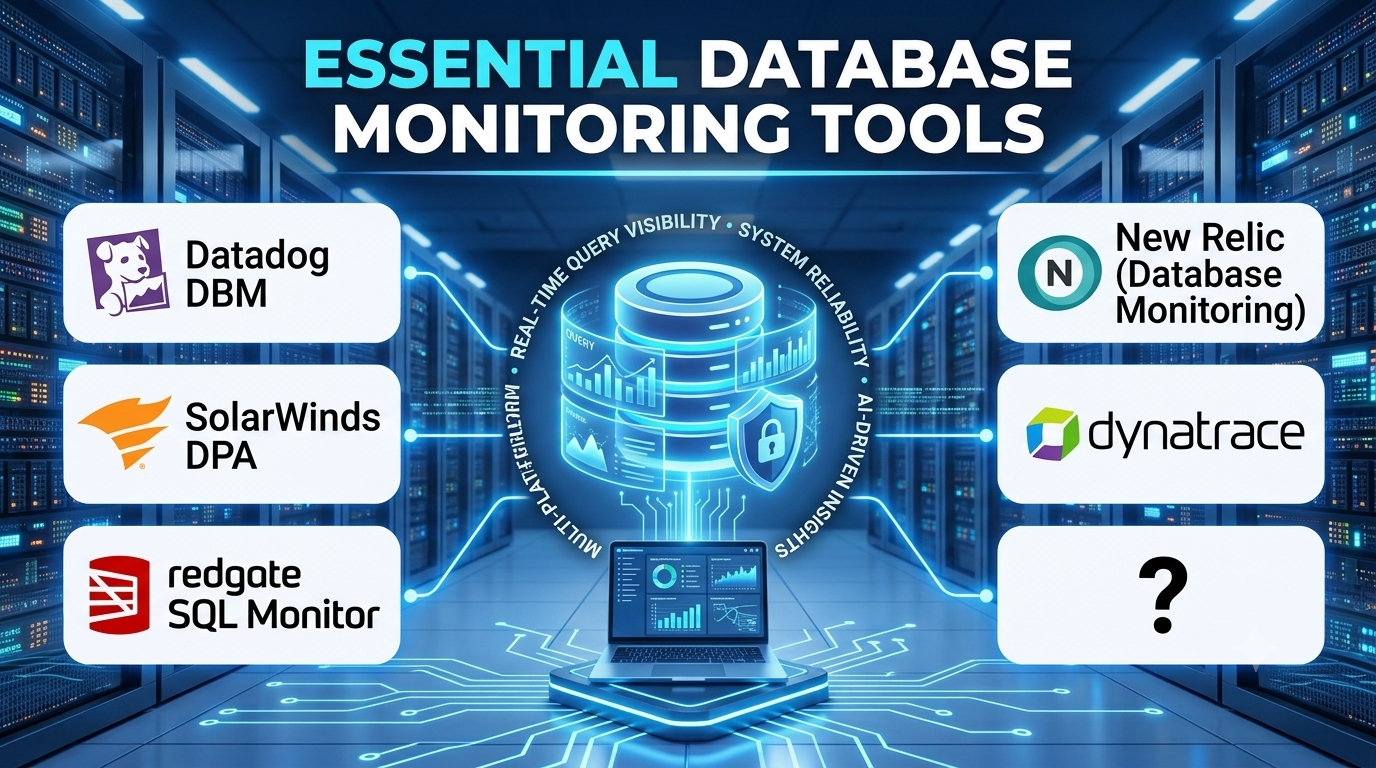
Engineering teams and database administrators historically diagnosed application slowdowns by reacting to panicked user complaints, frantically running manual EXPLAIN plans, and digging through static server log files after an outage had already crippled production. When database architectures consisted of a single monolithic relational server hosted on-premises, manual troubleshooting was tedious but manageable. Today, modern distributed applications distribute data across complex multi-cloud clusters, containerized microservices, and managed NoSQL instances. Waiting for a slow query log to reveal a performance bottleneck in a distributed database cluster guarantees frustrated users and lost revenue.
Database Monitoring Tools (DMTs) provide real-time visibility into query performance, resource utilization, index efficiency, and transaction latency across complex data stacks. Navigating the modern database monitoring landscape requires understanding how platforms differentiate in metric granularity, anomaly detection, and cross-platform architecture support.
Understanding the Core Objectives of Database Performance Monitoring
Database monitoring software encompasses specialized applications designed to track, analyze, and alert on the health, performance, and availability of relational and non-relational databases.
Unlike general-purpose infrastructure monitoring that tracks basic server CPU and memory usage, database monitoring tools inspect the internal mechanics of the database engine itself.
A professional database monitoring architecture typically governs several critical operational areas:
- Query Performance Analysis: Identifying slow-running queries, evaluating execution plans, and highlighting missing indexes or inefficient table scans.
- Resource Utilization Tracking: Monitoring memory allocation, disk I/O bottlenecks, connection pool limits, and CPU throttling.
- Lock and Deadlock Detection: Tracking transaction locks and blocking chains that cause application threads to hang indefinitely.
- Real-Time Alerting and Anomaly Detection: Triggering automated notifications when performance metrics deviate from established operational baselines.
The primary objective is to shift database management from a reactive firefighting exercise into a proactive, data-driven reliability discipline.
Key Evaluation Criteria for Database Monitoring Software
Selecting an enterprise-grade database monitoring solution requires examining metric collection overhead, multi-platform compatibility, and root-cause analysis depth.
Low-Collection Overhead and Performance Impact
A monitoring tool should never degrade the performance of the databases it watches. Exceptional platforms utilize lightweight agents or out-of-band telemetry collection to gather deep performance metrics without adding CPU or memory strain to production workloads.
Query-Level Diagnostics and Execution Plan Visualizer
Knowing that a database is slow is only half the battle. A robust monitoring tool provides deep query-level breakdowns, showing exact execution plans, parameter values, and cost factors so engineers can optimize inefficient SQL statements immediately.
Unified Visibility Across Heterogeneous Data Stores
Modern tech stacks rarely rely on a single database technology. An effective monitoring platform must provide unified dashboards across traditional relational databases (PostgreSQL, MySQL, SQL Server, Oracle) as well as cloud data warehouses and NoSQL stores (Snowflake, MongoDB, Redis).
Leading Database Monitoring Tools and Platforms
The database monitoring software market features dedicated database performance specialists alongside comprehensive observability platforms.
Datadog Database Monitoring (DBM)
Datadog offers a powerful, cloud-native database monitoring platform that unifies query performance metrics, infrastructure health, and application tracing into a single dashboard.
- Primary Focus: Cloud-native database observability, query telemetry, and unified infrastructure tracing.
- Deployment Model: Cloud SaaS platform with lightweight agent integration.
- Significant Advantage: Seamless correlation between application code traces (APM) and underlying database query performance, enabling rapid end-to-end root-cause analysis.
- Important Limitation: Pricing scales based on host and metric volume, which can become costly for massive, highly distributed database fleets.
SolarWinds Database Performance Analyzer (DPA)
SolarWinds DPA is an enterprise-grade database performance monitoring tool renowned for its response-time-analysis methodology, helping DBAs identify exact bottlenecks quickly.
- Primary Focus: Deep database performance tuning, response time analysis, and historical trend reporting.
- Deployment Model: On-premises or hybrid deployment.
- Significant Advantage: Exceptional root-cause analysis engine focused on waiting states, helping engineers pinpoint exactly what a query is waiting on (disk, lock, CPU).
- Important Limitation: User interface and feature sets are tailored primarily for traditional database administrators rather than modern cloud-native developers.
Redgate SQL Monitor
Redgate SQL Monitor is a specialized, industry-leading database monitoring and alerting tool built specifically for Microsoft SQL Server and PostgreSQL environments.
- Primary Focus: Real-time SQL Server and PostgreSQL performance monitoring, alerting, and estate diagnostics.
- Deployment Model: Self-hosted web application with lightweight server collection agents.
- Significant Advantage: Unmatched depth in monitoring Microsoft SQL Server specific metrics, deadlock graphs, and server configuration drift.
- Important Limitation: Optimized primarily for SQL Server and PostgreSQL ecosystems, making it less suitable for organizations managing diverse multi-engine cloud data lakes.
New Relic (Database Monitoring)
New Relic provides comprehensive application and database monitoring, offering rich telemetry, slow query tracking, and automated anomaly detection across modern web applications.
- Primary Focus: Full-stack application performance monitoring (APM) with integrated database metrics.
- Deployment Model: Cloud SaaS platform with unified agent deployment.
- Significant Advantage: Excellent out-of-the-box visibility for modern cloud applications, containerized microservices, and managed database services.
- Important Limitation: Advanced, highly granular DBA-level tuning features are less extensive than specialist tools like SolarWinds DPA.
Dynatrace
Dynatrace delivers enterprise AI-driven observability, utilizing an advanced causal AI engine to automatically detect and diagnose database performance anomalies across massive enterprise architectures.
- Primary Focus: AI-powered automated root-cause analysis, enterprise observability, and cloud infrastructure monitoring.
- Deployment Model: SaaS or managed hybrid deployment.
- Significant Advantage: Artificial intelligence engine (Davis) automatically isolates whether a performance degradation stems from application code, network latency, or database locking.
- Important Limitation: High enterprise licensing cost and complex deployment scope cater primarily to large corporate environments.
Platform Comparison Overview
| Product | Primary Focus | Deployment Model | Significant Advantage | Important Limitation |
| Datadog DBM | Cloud-native APM and unified query observability | Cloud SaaS | Seamless correlation between application traces and database queries | Pricing scales with infrastructure and metric volume |
| SolarWinds DPA | Deep response-time analysis and DBA performance tuning | On-Prem / Hybrid | Superior wait-state analysis for pinpointing exact query bottlenecks | Geared toward traditional DBAs over modern cloud developers |
| Redgate SQL Monitor | Specialized Microsoft SQL Server and PostgreSQL monitoring | Self-Hosted Web | Unmatched depth in SQL Server diagnostics and deadlock tracking | Focused heavily on specific relational engines over diverse data lakes |
| New Relic | Full-stack application and database performance monitoring | Cloud SaaS | Rapid setup and strong integration with modern microservice architectures | Advanced DBA diagnostic controls are lighter than specialist tools |
| Dynatrace | AI-driven enterprise root-cause analysis and observability | Cloud SaaS / Hybrid | Automated causal AI engine (Davis) instantly detects failure origins | High enterprise licensing costs and complex platform scale |
Operational Risks and Common Pitfalls
Implementing database monitoring tools without proper configuration introduces operational blind spots and alert fatigue.
Drowning in Noisy, Unactionable Alerts
Configuring monitoring thresholds too sensitively triggers a flood of low-priority alerts for minor CPU spikes, causing operations teams to ignore critical warnings during a real outage.
Monitoring Infrastructure Without Inspecting Query Logic
Tracking basic server uptime and memory usage while failing to capture individual query execution plans leaves teams blind to inefficient code introduced during software deployments.
Neglecting Cloud Database Throttling Limits
Monitoring managed cloud databases (such as AWS RDS or Azure SQL) requires tracking provider-specific throttling metrics (like IOPS limits), not just traditional operating system counters.
Questions to Guide Vendor Selection
Before procuring a database monitoring tool, engineering managers and database administrators should address several critical operational questions:
- Does the monitoring platform support our entire database inventory across relational engines, NoSQL stores, and cloud data warehouses?
- How does the tool collect metrics? What is the performance overhead of the monitoring agent on production database servers?
- Does the platform provide deep query-level execution plan analysis, or does it only track high-level server resource utilization?
- How easily do alerts integrate with our existing incident response and on-call rotation systems (such as PagerDuty or Slack)?
Making the Final Decision
Choosing a database monitoring tool depends heavily on an organization’s tech stack, engineering culture, and performance diagnostic requirements.
Cloud-native development teams seeking unified visibility across application code and database queries frequently choose modern observability platforms like Datadog or New Relic. Traditional database administrators and enterprise DBAs managing complex relational estates benefit immensely from specialist tuning tools like SolarWinds DPA or Redgate SQL Monitor. Conversely, large enterprises managing massive hybrid infrastructures rely on AI-driven platforms like Dynatrace.
Ultimately, modern database monitoring tools transform unpredictable performance bottlenecks into transparent, manageable metrics, ensuring uninterrupted system reliability.
