Introduction
Modern marketing rarely produces conversions through a single interaction.
Customers often discover brands through advertisements, explore websites, read educational content, subscribe to newsletters, and compare alternatives before making purchasing decisions.
A business-to-business buyer may attend a webinar, download a guide, visit a pricing page, and request a demonstration. Meanwhile, other employees from the same organization may interact with different campaigns.
When marketers evaluate only the final interaction, they risk overlooking activities that helped introduce, educate, or engage potential customers.
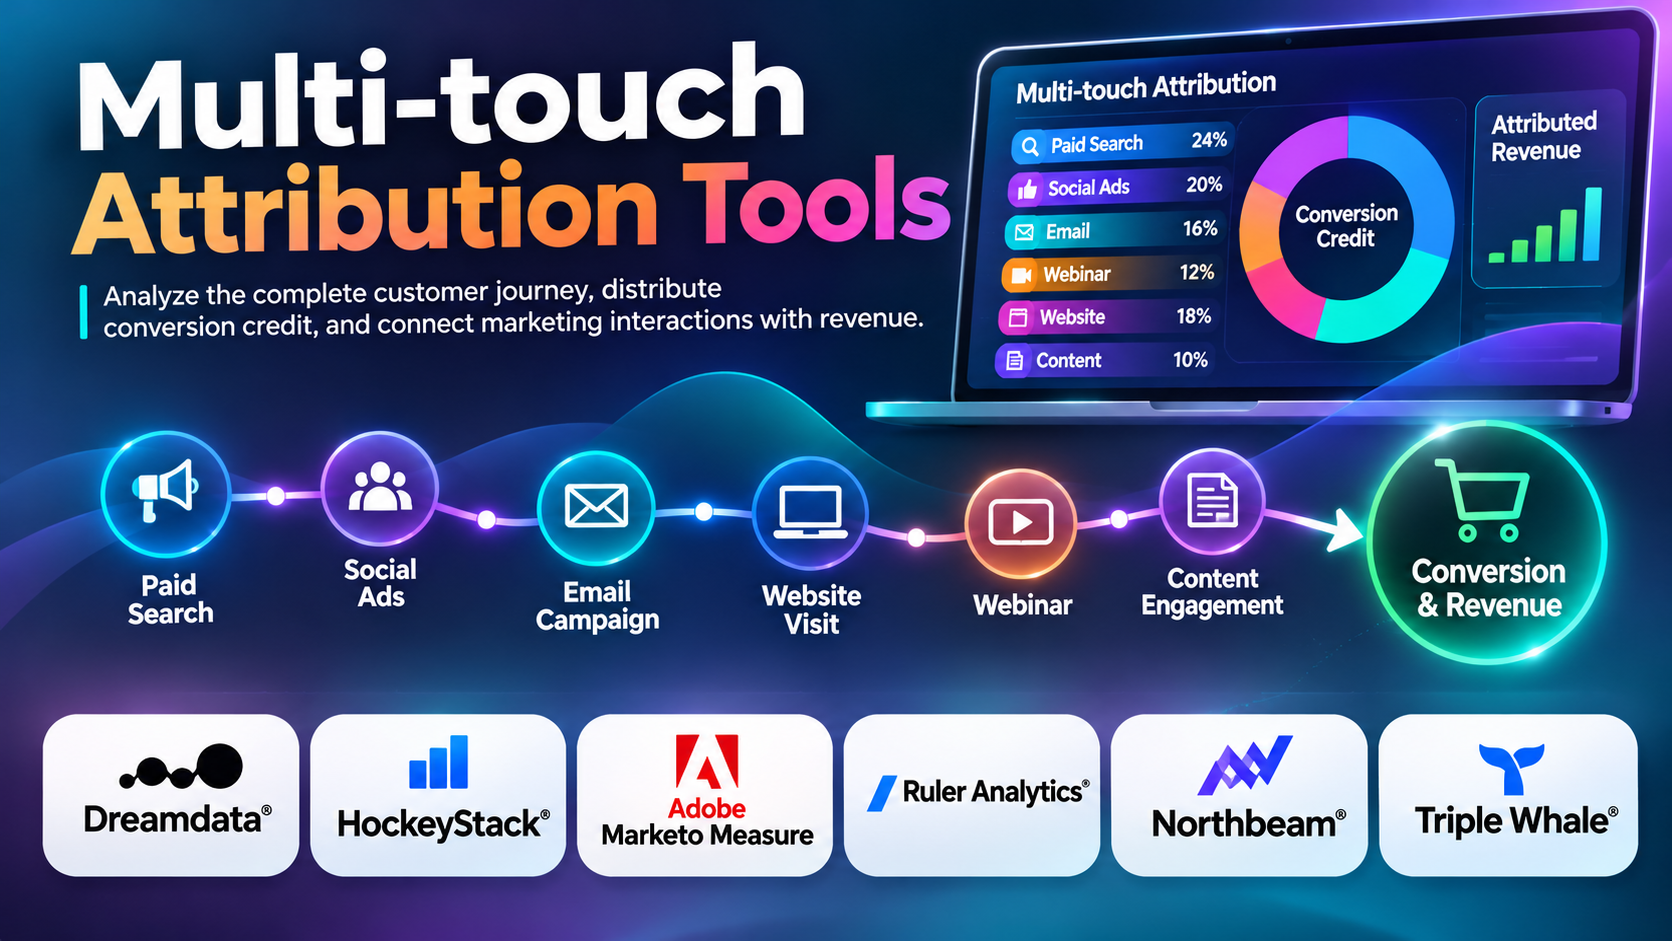
Multi-touch attribution provides a framework for analyzing multiple interactions associated with a conversion.
Instead of assigning all credit to one touchpoint, multi-touch attribution distributes credit across selected interactions using predefined rules or analytical models.
This approach can provide a broader view of recorded customer journeys.
For example, a company may discover that educational content frequently appears early in successful journeys, while paid search and email campaigns often appear closer to conversion.
These findings can help marketers investigate how different channels support customer acquisition.
Multi-touch attribution tools collect marketing data, connect eligible interactions, apply attribution models, and present results through reports and dashboards.
Some solutions specialize in B2B revenue attribution, where multiple contacts influence opportunities over long sales cycles.
Others focus on e-commerce marketing, digital analytics, mobile acquisition, or enterprise customer journey analysis.
However, multi-touch attribution has important limitations.
Privacy restrictions, incomplete tracking, cross-device behavior, offline interactions, and identity resolution challenges can prevent platforms from observing the complete customer journey.
Additionally, assigning attribution credit does not prove that an interaction caused a conversion.
Reliable marketing measurement therefore requires multi-touch attribution to be interpreted alongside incrementality experiments, media mix modeling, and broader business evidence.
This guide compares ten multi-touch attribution tools, explains their capabilities, and provides practical guidance for selecting and implementing an appropriate solution.
What Are Multi-touch Attribution Tools?
Multi-touch attribution tools are marketing analytics platforms that distribute conversion credit across multiple recorded customer interactions.
They help organizations understand how different marketing touchpoints appear within journeys associated with conversions, opportunities, or revenue.
A touchpoint may include:
- Paid search advertisements.
- Organic search visits.
- Social media campaigns.
- Email marketing interactions.
- Content downloads.
- Webinar registrations.
- Website visits.
- Referral traffic.
- Product demonstrations.
- Eligible offline marketing interactions.
Multi-touch attribution is particularly relevant when customers interact with several channels before making decisions.
How Multi-touch Attribution Works
A typical multi-touch attribution process involves seven stages.
1. Collect marketing interactions: Gather eligible touchpoint data from websites, advertising platforms, marketing automation systems, and other sources.
2. Identify conversions: Define outcomes such as purchases, qualified leads, subscriptions, opportunities, or closed revenue.
3. Associate interactions: Connect available touchpoints to the same customer, account, or conversion journey where permitted and technically possible.
4. Select attribution models: Choose how conversion credit should be distributed.
5. Calculate attribution: Apply the selected rules or statistical methods.
6. Analyze results: Compare credited outcomes across channels, campaigns, and journey stages.
7. Inform decisions: Use the findings to investigate marketing performance and identify opportunities for further testing.
Common Multi-touch Attribution Models
Linear Attribution
Linear attribution assigns equal credit to every eligible touchpoint.
For example, if a journey includes four recorded interactions, each receives 25% of the conversion credit.
This method is easy to understand but assumes equal contribution.
Time-Decay Attribution
Time-decay attribution assigns more credit to interactions closer to conversion.
It may be useful for examining recent marketing activity, but its weighting is an assumption rather than proof of causal influence.
Position-Based Attribution
Position-based attribution emphasizes selected stages of the journey.
A common configuration gives greater credit to the first and last interactions while distributing the remainder across intermediate touchpoints.
W-Shaped Attribution
W-shaped attribution is often used in B2B marketing.
It typically emphasizes three milestones: first interaction, lead creation, and opportunity creation.
The exact allocation varies by implementation.
Full-Path Attribution
Full-path attribution may distribute credit across important stages extending from initial engagement through opportunity development and revenue.
It is relevant to organizations with complex sales processes.
Data-Driven Attribution
Data-driven attribution uses statistical or algorithmic methods to allocate credit based on observed data patterns.
Its usefulness depends on tracking coverage, model assumptions, and the quality of available data.
Benefits of Multi-touch Attribution
Multi-touch attribution can help businesses:
- Examine more complete recorded customer journeys.
- Understand interactions across marketing channels.
- Compare campaign performance.
- Investigate early-stage demand generation.
- Connect marketing with pipeline and revenue.
- Improve sales and marketing reporting.
- Evaluate content engagement.
- Identify gaps in tracking.
- Support marketing planning.
- Generate hypotheses for incrementality testing.
The main advantage is broader journey visibility. The main limitation is that attribution credit should not be confused with demonstrated incremental impact.
Top 10 Multi-touch Attribution Tools
1. Dreamdata
Short Description
Dreamdata is a B2B revenue attribution and analytics platform designed to connect marketing interactions with account-level journeys, pipeline, and revenue.
It is particularly relevant to companies where multiple people participate in purchasing decisions.
Traditional contact-level attribution can be insufficient for B2B organizations because several employees from the same account may engage with marketing content before a deal closes.
Dreamdata helps organizations analyze relevant interactions across these complex journeys.
For example, a SaaS company may want to understand how paid advertising, webinars, organic content, and email campaigns relate to qualified opportunities.
The platform can connect eligible marketing data with CRM records and other supported systems.
This helps teams investigate the relationship between marketing engagement and revenue outcomes.
Dreamdata is especially useful for organizations with established CRM processes and reliable account data.
However, its reports remain dependent on identity association, tracking coverage, and attribution assumptions.
Key Features
- Multi-touch Attribution: Distributes eligible conversion credit across recorded interactions.
- Account-Based Analytics: Examines marketing activity associated with business accounts.
- Revenue Attribution: Connects eligible touchpoints with sales outcomes.
- CRM Integration: Supports relevant sales data connections.
- Marketing Data Integration: Combines information from supported marketing systems.
- Pipeline Analytics: Examines relationships between campaigns and opportunities.
- Customer Journey Reporting: Presents account-level interaction histories.
- Attribution Model Comparison: Supports applicable analysis of different credit allocation methods.
- Revenue Dashboards: Communicates marketing-related performance indicators.
Benefits
- Improves visibility into B2B journeys.
- Connects marketing with pipeline outcomes.
- Supports account-based analysis.
- Helps investigate demand generation.
- Improves marketing and sales alignment.
- Provides broader revenue reporting.
- Supports multi-channel analysis.
Pros
- B2B attribution specialization.
- Account-level measurement.
- CRM integrations.
- Revenue analytics.
- Multi-touch reporting.
- Relevant to long sales cycles.
Cons
- Requires reliable CRM data.
- Identity matching may be incomplete.
- Implementation can involve several systems.
- Commercial pricing requires evaluation.
- Attribution estimates are not causal proof.
Use Cases
B2B SaaS Revenue Attribution: A software company analyzes marketing interactions associated with closed deals.
Account-Based Marketing: A team investigates engagement across target accounts.
Pipeline Reporting: Marketing leadership examines campaigns appearing in opportunity journeys.
Demand Generation Analysis: A company evaluates content, webinars, and paid advertising.
Best For
B2B SaaS companies, revenue operations teams, account-based marketers, and organizations with complex sales cycles.
2. HockeyStack
Short Description
HockeyStack is a B2B marketing analytics platform focused on customer journey measurement, revenue attribution, and related marketing performance analysis.
It is relevant to organizations that want to connect marketing interactions with opportunities and sales outcomes.
HockeyStack can help marketers investigate how recorded touchpoints appear throughout the customer journey.
For example, a B2B technology company may want to understand whether paid campaigns, website content, and webinars are associated with accounts that become qualified opportunities.
The platform can support this analysis through relevant integrations and attribution reporting.
HockeyStack is particularly useful when marketing teams need more than isolated campaign dashboards.
Its revenue-oriented approach can support discussions between marketing, sales, and finance.
However, organizations should examine the completeness of their tracking and CRM data before relying on attribution reports.
Missing interactions and identity limitations can affect the results.
Key Features
- Multi-touch Attribution: Supports analysis of multiple marketing interactions.
- B2B Customer Journey Analytics: Examines recorded account and contact activity.
- Revenue Attribution: Connects marketing data with relevant sales outcomes.
- CRM Integration: Supports eligible sales system connections.
- Pipeline Reporting: Analyzes opportunity-related performance.
- Campaign Analytics: Compares marketing activities.
- Account-Level Analysis: Supports relevant buying-group measurement.
- Data Integration: Combines supported marketing information.
- Performance Dashboards: Presents attribution and revenue metrics.
Benefits
- Supports B2B journey analysis.
- Connects campaigns with pipeline.
- Improves revenue reporting.
- Helps evaluate demand generation.
- Supports cross-channel visibility.
- Encourages marketing and sales alignment.
- Reduces fragmented analytics.
Pros
- B2B marketing focus.
- Revenue attribution.
- Customer journey reporting.
- CRM integrations.
- Pipeline analysis.
- Relevant to demand generation.
Cons
- CRM accuracy is essential.
- Identity association can be incomplete.
- Complex setups require technical coordination.
- Commercial costs require evaluation.
- Attribution should be validated with other evidence.
Use Cases
Demand Generation Measurement: A company analyzes marketing engagement across channels.
Pipeline Attribution: A business connects eligible touchpoints with opportunities.
Account Journey Research: Marketers investigate engagement among buying groups.
Revenue Reporting: Leadership reviews marketing-associated sales outcomes.
Best For
B2B technology companies, demand generation teams, revenue operations departments, and SaaS businesses.
3. Adobe Marketo Measure
Short Description
Adobe Marketo Measure is a B2B marketing attribution solution associated with Adobe’s marketing technology ecosystem.
It is designed to help organizations connect marketing touchpoints with lead, opportunity, and revenue-related outcomes.
Marketo Measure is particularly relevant to businesses with established marketing automation and CRM processes.
B2B customer journeys often include multiple stages, such as initial engagement, lead creation, opportunity development, and closed revenue.
The platform supports attribution approaches intended to examine these stages.
For example, an enterprise software company may want to understand how events, digital advertising, content downloads, and email campaigns appear in successful sales journeys.
Marketo Measure can help organize eligible interactions and distribute attribution credit according to selected models.
However, implementation requires attention to CRM structure, campaign tracking, data governance, and the attribution methodology.
Organizations should verify current Adobe packaging and product availability before purchasing.
Key Features
- B2B Multi-touch Attribution: Supports credit allocation across marketing interactions.
- Revenue Attribution: Connects eligible marketing activity with sales outcomes.
- Opportunity Measurement: Supports attribution related to CRM opportunities.
- Touchpoint Tracking: Organizes recorded marketing interactions.
- Attribution Models: Supports relevant B2B credit allocation approaches.
- CRM Integration: Connects with supported sales systems.
- Marketing Automation Integration: Supports eligible marketing workflows.
- Revenue Reporting: Presents marketing-related pipeline and revenue metrics.
- Enterprise Governance: Supports relevant administrative processes.
Benefits
- Connects marketing with sales outcomes.
- Supports B2B revenue reporting.
- Helps analyze long sales cycles.
- Provides structured attribution models.
- Supports enterprise marketing operations.
- Improves campaign visibility.
- Helps coordinate marketing and sales measurement.
Pros
- B2B attribution specialization.
- Opportunity and revenue reporting.
- Multiple attribution approaches.
- Enterprise marketing applications.
- CRM integrations.
- Relevant to established marketing operations.
Cons
- Implementation can be complex.
- CRM data quality strongly affects results.
- Commercial pricing requires consultation.
- Administrative expertise may be necessary.
- Missing touchpoints can distort attribution.
Use Cases
Enterprise B2B Attribution: A technology company examines interactions preceding opportunities.
Marketing Automation Measurement: A business connects campaigns with revenue reporting.
Event Attribution: A company investigates the role of webinars and conferences.
Sales Pipeline Analysis: Leadership examines marketing-associated pipeline.
Best For
Enterprise B2B organizations, marketing operations teams, Adobe marketing technology users, and companies requiring structured revenue attribution.
4. Ruler Analytics
Short Description
Ruler Analytics is a marketing attribution and revenue tracking platform focused on connecting marketing interactions with leads and sales.
It is particularly useful for businesses that generate inquiries through websites, forms, telephone calls, and other lead-generation channels.
Many organizations can measure website visits and form submissions but struggle to connect those interactions with revenue recorded later.
Ruler Analytics helps bridge this gap through eligible tracking and CRM integration workflows.
For example, a professional services company may receive inquiries from paid search, organic search, and referral campaigns.
Some leads may become paying customers several weeks later.
Ruler Analytics can help the marketing team investigate which recorded sources are associated with those sales.
Its multi-touch capabilities can provide broader journey visibility than a simple last-click report.
However, results depend on accurate lead matching, CRM records, and the completeness of tracked interactions.
Key Features
- Multi-touch Attribution: Supports credit allocation across eligible interactions.
- Lead Tracking: Connects recorded marketing sources with inquiries.
- Revenue Attribution: Associates eligible interactions with sales outcomes.
- Call Tracking: Supports relevant telephone conversion measurement.
- Form Tracking: Captures configured website lead submissions.
- CRM Integration: Connects marketing and sales records.
- Customer Journey Reporting: Examines recorded lead interactions.
- Campaign Analytics: Compares marketing performance.
- Revenue Dashboards: Presents lead and sales attribution information.
Benefits
- Connects marketing with revenue.
- Supports lead-generation analysis.
- Improves visibility into telephone inquiries.
- Helps compare acquisition sources.
- Supports multi-touch journey reporting.
- Reduces reliance on lead counts alone.
- Encourages sales and marketing alignment.
Pros
- Lead-generation specialization.
- Revenue attribution.
- Call tracking.
- Form tracking.
- CRM integration.
- Multi-touch reporting.
Cons
- Identity matching can be incomplete.
- CRM data quality is critical.
- Tracking requires careful implementation.
- Commercial pricing requires evaluation.
- Attribution does not establish incrementality.
Use Cases
Professional Services: A consultancy connects marketing inquiries with revenue.
Call-Driven Marketing: A business evaluates telephone leads.
B2B Lead Generation: A company examines marketing sources associated with closed sales.
CRM Attribution: A marketing team connects campaign records with sales outcomes.
Best For
Professional services firms, B2B lead-generation companies, agencies, and organizations focused on lead-to-revenue attribution.
5. Wicked Reports
Short Description
Wicked Reports is a marketing attribution platform associated with customer journey analysis and revenue measurement.
It is particularly relevant to businesses with recurring purchases, subscription revenue, or extended customer relationships.
Traditional advertising reports often focus on immediate conversions.
However, some businesses generate significant value through repeat purchases or subscriptions after the initial acquisition.
Wicked Reports can help marketers investigate recorded marketing interactions in relation to customer acquisition and revenue.
For example, an online education company may acquire customers through paid advertising, email campaigns, and content marketing.
Some customers may purchase additional courses or maintain subscriptions over time.
The platform’s attribution approach is relevant to organizations that want to consider longer-term customer value.
However, businesses should carefully review the current product offering, supported integrations, attribution methodology, and commercial terms.
Key Features
- Multi-touch Attribution: Supports analysis of multiple recorded interactions.
- Revenue Attribution: Connects eligible marketing activity with purchases.
- Customer Journey Reporting: Examines relevant acquisition paths.
- Customer Value Analysis: Supports applicable revenue-oriented measurement.
- Campaign Analytics: Compares marketing sources.
- Advertising Integrations: Connects with supported platforms.
- Conversion Tracking: Measures configured outcomes.
- Performance Reporting: Presents attribution metrics.
- Marketing Decision Support: Helps evaluate acquisition strategies.
Benefits
- Supports revenue-oriented attribution.
- Helps analyze longer customer relationships.
- Provides multi-touch visibility.
- Connects campaigns with purchases.
- Supports customer acquisition analysis.
- Helps investigate repeat revenue.
- Improves marketing reporting.
Pros
- Revenue attribution focus.
- Multi-touch analysis.
- Customer journey reporting.
- Relevant to recurring revenue.
- Campaign measurement.
- Marketing performance dashboards.
Cons
- Current feature availability requires verification.
- Commercial pricing requires evaluation.
- Integration coverage varies.
- Identity limitations affect reporting.
- Long-term attribution assumptions require scrutiny.
Use Cases
Subscription Marketing: A business examines acquisition campaigns and recurring revenue.
Online Education: A company investigates marketing interactions preceding course purchases.
E-commerce Attribution: A retailer evaluates recorded acquisition journeys.
Customer Value Reporting: A marketing team examines acquisition sources associated with repeat purchases.
Best For
Subscription businesses, online education companies, e-commerce marketers, and organizations interested in revenue-oriented attribution.
6. Northbeam
Short Description
Northbeam is a marketing measurement and attribution platform focused on e-commerce and consumer brands.
It helps organizations analyze advertising performance across multiple channels.
E-commerce businesses frequently receive different conversion totals and revenue estimates from advertising networks, analytics tools, and commerce systems.
Northbeam provides attribution-related reporting intended to support cross-channel marketing analysis.
For example, a direct-to-consumer retailer may advertise through paid search, social media, video, and other digital platforms.
The marketing team wants to investigate how recorded interactions relate to purchases.
Northbeam can support these workflows through its marketing measurement capabilities.
Its value is strongest for organizations with substantial digital advertising activity.
However, attribution reports remain subject to tracking limitations, attribution windows, identity resolution, and modeling assumptions.
Key Features
- Multi-touch Attribution: Supports relevant cross-channel credit allocation.
- E-commerce Measurement: Connects marketing with purchase outcomes.
- Advertising Integrations: Combines supported campaign information.
- Customer Journey Analysis: Examines recorded conversion paths.
- Revenue Reporting: Presents marketing-related commerce outcomes.
- Campaign Analytics: Compares advertising activities.
- Cross-Channel Reporting: Supports analysis across marketing sources.
- Performance Dashboards: Organizes relevant metrics.
- Marketing Decision Support: Helps investigate spending performance.
Benefits
- Improves cross-channel visibility.
- Supports e-commerce attribution.
- Connects campaigns with revenue.
- Reduces dependence on isolated platform dashboards.
- Helps investigate customer acquisition.
- Supports marketing reporting.
- Provides a broader view of recorded journeys.
Pros
- E-commerce specialization.
- Multi-touch measurement.
- Cross-channel reporting.
- Revenue analytics.
- Advertising integrations.
- Relevant to performance marketing.
Cons
- Commercial pricing requires evaluation.
- Attribution methodology must be understood.
- Tracking coverage can be incomplete.
- Less focused on B2B account journeys.
- Reported credit does not prove causality.
Use Cases
DTC Attribution: A retailer evaluates recorded marketing journeys.
Paid Media Analysis: A team compares advertising channels.
E-commerce Reporting: A company connects campaign metrics with purchases.
Growth Marketing: Leadership investigates customer acquisition performance.
Best For
Direct-to-consumer brands, e-commerce retailers, performance marketing teams, and companies with substantial digital advertising investment.
7. Triple Whale
Short Description
Triple Whale is an e-commerce analytics and marketing measurement platform focused on helping merchants understand advertising performance and store outcomes.
It provides attribution-related capabilities relevant to businesses selling products online.
E-commerce teams often manage advertising across several platforms while relying on separate storefront and analytics reports.
Triple Whale helps consolidate relevant information into a more unified environment.
For example, a consumer goods brand may want to compare advertising expenditure, customer acquisition, and revenue across channels.
The platform can support this analysis through relevant commerce and marketing integrations.
Triple Whale is particularly useful for businesses that want attribution alongside broader e-commerce performance reporting.
However, marketers should understand the differences between platform-reported conversions, attribution estimates, and actual incremental outcomes.
Key Features
- Marketing Attribution: Supports relevant conversion credit reporting.
- E-commerce Analytics: Examines store performance.
- Advertising Data Integration: Connects with supported marketing platforms.
- Revenue Dashboards: Presents commerce outcomes.
- Customer Acquisition Analysis: Examines acquisition-related metrics.
- Cross-Channel Reporting: Compares marketing sources.
- Commerce Integrations: Connects with supported storefront systems.
- Campaign Analytics: Organizes advertising performance.
- Marketing Decision Support: Helps evaluate spending patterns.
Benefits
- Consolidates commerce and marketing reporting.
- Supports attribution analysis.
- Helps compare advertising channels.
- Connects marketing with revenue.
- Reduces dashboard fragmentation.
- Supports customer acquisition reporting.
- Improves e-commerce visibility.
Pros
- E-commerce analytics specialization.
- Attribution capabilities.
- Commerce integrations.
- Advertising dashboards.
- Customer acquisition analysis.
- Relevant to DTC brands.
Cons
- Primarily oriented toward commerce businesses.
- Attribution models require careful interpretation.
- Integration availability varies.
- Commercial pricing depends on the offering.
- Different platforms may report conflicting results.
Use Cases
Online Retail Marketing: A retailer examines advertising performance.
DTC Customer Acquisition: A brand compares marketing sources.
Store Revenue Analysis: A team connects campaign activity with sales.
Marketing Dashboard Consolidation: A business organizes commerce metrics.
Best For
E-commerce merchants, direct-to-consumer brands, Shopify-oriented businesses, and growth marketing teams.
8. Google Analytics 4
Short Description
Google Analytics 4 is a digital analytics platform that provides attribution capabilities as part of its broader website and application measurement environment.
It is relevant to businesses that want to understand how recorded acquisition channels relate to conversions.
GA4 uses event-based data collection and supports eligible attribution reporting.
For example, an online retailer may want to investigate the roles of organic search, paid search, email, and referral traffic before purchases.
GA4 can help marketers examine conversion paths and compare selected attribution views.
Its integration with Google Ads is useful for organizations operating within Google’s advertising ecosystem.
However, GA4 is not a dedicated B2B revenue attribution system.
Its measurement is constrained by consent, available identifiers, implementation quality, and the reporting capabilities provided.
Businesses should also verify which attribution models are currently supported rather than assuming every historical model remains available.
Key Features
- Event-Based Measurement: Tracks configured digital interactions.
- Attribution Reporting: Supports eligible conversion credit analysis.
- Conversion Paths: Examines recorded interactions preceding key events.
- Acquisition Analytics: Reports traffic and user acquisition sources.
- Key Event Tracking: Measures important outcomes.
- Audience Segmentation: Supports relevant user analysis.
- Google Ads Integration: Connects supported advertising workflows.
- Exploration Reports: Provides flexible analytical views.
- Data Export: Supports applicable advanced analysis.
Benefits
- Provides accessible attribution capabilities.
- Supports website and app measurement.
- Helps analyze conversion journeys.
- Connects acquisition with business outcomes.
- Supports campaign reporting.
- Integrates with Google advertising.
- Provides flexible event analytics.
Pros
- Broad digital analytics functionality.
- Attribution reporting.
- Conversion path analysis.
- Google Ads integration.
- Event-based measurement.
- Suitable for many businesses.
Cons
- Not a specialized B2B revenue attribution platform.
- Tracking configuration requires attention.
- Privacy restrictions limit visibility.
- Attribution model availability can change.
- Reports do not represent every interaction.
Use Cases
Website Attribution: A business examines digital acquisition channels.
E-commerce Analysis: A retailer investigates conversion paths.
Lead Generation: A service company tracks form submissions.
Campaign Reporting: A marketing team compares eligible channel performance.
Best For
Small and medium-sized businesses, digital marketers, e-commerce teams, and organizations already using Google Analytics.
9. Adobe Analytics
Short Description
Adobe Analytics is an enterprise digital analytics platform offering advanced measurement, segmentation, and reporting capabilities.
It supports attribution analysis within broader digital customer journey research.
Adobe Analytics is particularly relevant to organizations with complex websites, digital products, and customized reporting requirements.
For example, a financial services company may want to understand how customers interact with educational content, product comparison pages, and application forms.
The analytics team can use relevant attribution views to examine recorded interactions associated with conversions.
Adobe Analytics provides flexibility for organizations requiring detailed analysis and enterprise governance.
However, sophisticated implementation requires experienced analysts and technical resources.
Organizations should verify which attribution features are included in their specific Adobe products and contracts.
Key Features
- Digital Interaction Analytics: Measures configured customer activity.
- Attribution Analysis: Supports relevant credit allocation approaches.
- Customer Journey Reporting: Examines recorded interactions.
- Advanced Segmentation: Supports detailed audience analysis.
- Custom Metrics: Allows business-specific reporting.
- Conversion Analysis: Investigates important digital outcomes.
- Reporting Workspaces: Supports flexible exploration.
- Enterprise Governance: Provides relevant administrative capabilities.
- Adobe Integrations: Connects with supported ecosystem products.
Benefits
- Supports complex digital measurement.
- Provides flexible attribution analysis.
- Helps examine customer journeys.
- Supports detailed segmentation.
- Enables customized reporting.
- Connects with enterprise analytics workflows.
- Supports large analytical teams.
Pros
- Advanced digital analytics.
- Attribution capabilities.
- Flexible reporting.
- Enterprise customization.
- Detailed segmentation.
- Relevant to complex organizations.
Cons
- Commercial costs may be substantial.
- Implementation requires specialist expertise.
- Configuration can be complex.
- Governance requires maintenance.
- Attribution remains limited by available data.
Use Cases
Enterprise Digital Attribution: A company analyzes conversion journeys.
Financial Services Marketing: A business examines interactions before applications.
Digital Experience Research: Analysts investigate engagement and conversions.
Customized Reporting: An enterprise develops attribution dashboards.
Best For
Large enterprises, digital analytics departments, Adobe ecosystem users, and organizations requiring advanced website attribution.
10. Factors.ai
Short Description
Factors.ai is a B2B marketing analytics and account intelligence platform associated with account identification, customer journey analysis, and marketing attribution.
It is particularly relevant to organizations that want to understand how business accounts engage with marketing activities.
B2B buying journeys often involve multiple stakeholders and interactions across different channels.
Factors.ai helps organizations investigate relevant account activity and marketing engagement.
For example, a B2B software company may want to identify which target accounts interact with advertising, website content, and other marketing activities before becoming opportunities.
The platform’s attribution-related capabilities can support analysis of these journeys.
It is particularly relevant to account-based marketing and demand generation teams.
However, account identification is not always complete or perfectly accurate.
Organizations should evaluate identity methodology, integration quality, privacy requirements, and the distinction between engagement signals and proven marketing impact.
Key Features
- B2B Attribution: Supports analysis of marketing interactions associated with outcomes.
- Account Intelligence: Provides relevant business account insights.
- Website Visitor Analysis: Supports eligible account-level engagement measurement.
- Customer Journey Reporting: Examines recorded interactions.
- Campaign Analytics: Compares relevant marketing activities.
- CRM Integration: Connects with supported sales systems.
- Account-Based Marketing Analytics: Supports target account research.
- Marketing Data Integration: Combines relevant information.
- Performance Reporting: Presents attribution and engagement metrics.
Benefits
- Supports account-based marketing.
- Helps analyze B2B journeys.
- Provides relevant account intelligence.
- Connects engagement with sales workflows.
- Supports demand generation analysis.
- Improves marketing visibility.
- Helps investigate campaign performance.
Pros
- B2B account intelligence focus.
- Attribution-related analytics.
- Website engagement analysis.
- CRM integrations.
- Account-based marketing applications.
- Relevant to SaaS companies.
Cons
- Account identification can be imperfect.
- Data coverage depends on available signals.
- Commercial pricing requires evaluation.
- Implementation requires governance.
- Engagement does not establish causal impact.
Use Cases
Account-Based Marketing: A team examines engagement among target companies.
B2B Demand Generation: A business investigates campaign interactions.
Website Account Analytics: Marketers analyze eligible account visits.
Pipeline Research: A company examines marketing activity associated with opportunities.
Best For
B2B SaaS companies, account-based marketing teams, demand generation departments, and revenue operations professionals.
Comparison Table: Top 10 Multi-touch Attribution Tools
| Tool | Best For | Primary Attribution Focus | Standout Capability | Pricing |
|---|---|---|---|---|
| Dreamdata | B2B SaaS companies | Account-based revenue attribution | B2B journey analytics | Commercial |
| HockeyStack | Demand generation teams | B2B pipeline attribution | Revenue journey reporting | Commercial |
| Adobe Marketo Measure | Enterprise B2B marketing | Lead and opportunity attribution | Structured B2B models | Commercial |
| Ruler Analytics | Lead-generation businesses | Lead-to-revenue attribution | Call and CRM tracking | Commercial |
| Wicked Reports | Subscription and commerce brands | Revenue-oriented attribution | Customer value analysis | Commercial |
| Northbeam | E-commerce advertisers | Cross-channel attribution | Paid media measurement | Commercial |
| Triple Whale | DTC merchants | Commerce attribution | Store and marketing analytics | Commercial/tiered |
| Google Analytics 4 | Website marketers | Digital conversion attribution | Conversion path reporting | Free/enterprise |
| Adobe Analytics | Large digital enterprises | Digital journey attribution | Advanced segmentation | Commercial |
| Factors.ai | Account-based marketers | B2B account attribution | Account intelligence | Commercial |
These solutions address different business models and measurement requirements. Their capabilities should be evaluated against actual use cases rather than treated as interchangeable.
How to Choose the Best Multi-touch Attribution Tool
1. Define the Conversion Outcome
Determine whether the business needs to measure purchases, leads, qualified opportunities, subscriptions, or closed revenue.
The platform should support the outcome most relevant to decision-making.
2. Understand the Customer Journey
Map the typical path from initial discovery to conversion.
A short e-commerce purchase journey requires different attribution capabilities from a complex enterprise sales cycle.
3. Identify Relevant Touchpoints
List important marketing interactions.
These may include advertising, website visits, webinars, email campaigns, events, and sales-related activities.
4. Evaluate Data Availability
Determine which interactions can be reliably collected.
Review missing identifiers, offline activity, consent limitations, and disconnected systems.
5. Examine Identity Resolution
Understand how the platform associates interactions with individuals or accounts.
Evaluate accuracy, privacy implications, and potential matching errors.
6. Compare Attribution Models
Review the available credit allocation approaches.
Choose models that support the intended analytical questions.
7. Assess CRM and Commerce Integrations
B2B companies should prioritize reliable CRM integration.
E-commerce businesses should evaluate storefront, advertising, and order data connections.
8. Review Reporting and Segmentation
Determine whether the platform supports campaign comparisons, customer journey analysis, revenue reporting, and relevant audience segments.
9. Consider Incrementality Validation
Use experiments, MMM, or other appropriate methods to investigate whether credited activities generate additional outcomes.
10. Calculate Total Cost
Include software licensing, implementation, technical resources, data processing, training, and ongoing maintenance.
Best Multi-touch Attribution Tools by User Type
| User Type | Recommended Tool | Reason |
|---|---|---|
| B2B SaaS company | Dreamdata | Account-level revenue attribution |
| Demand generation team | HockeyStack | Pipeline journey analysis |
| Enterprise marketing operations | Adobe Marketo Measure | Structured B2B attribution |
| Professional services company | Ruler Analytics | Lead and revenue tracking |
| Subscription business | Wicked Reports | Revenue-oriented attribution |
| DTC paid media team | Northbeam | Cross-channel e-commerce measurement |
| Online retailer | Triple Whale | Commerce marketing analytics |
| Small digital business | Google Analytics 4 | Accessible attribution reporting |
| Enterprise digital analytics team | Adobe Analytics | Advanced digital journey analysis |
| Account-based marketing team | Factors.ai | B2B account intelligence |
Practical Example: Implementing Multi-touch Attribution for a B2B Software Company
Consider a B2B software company selling cybersecurity solutions.
The business invests in paid search, LinkedIn advertising, webinars, email marketing, and educational content.
Its sales cycle typically lasts several months.
Multiple employees from the same customer organization may interact with marketing campaigns before a purchase.
The company wants to understand how recorded marketing touchpoints relate to qualified opportunities and revenue.
Step 1: Define the Measurement Objectives
The team identifies qualified opportunities and closed revenue as primary outcomes.
It also tracks lead creation as an intermediate milestone.
These definitions are documented across marketing and sales systems.
Step 2: Map the Customer Journey
Researchers identify important interactions.
These include website visits, content downloads, webinar registrations, demo requests, and sales meetings.
The team documents which interactions are measurable.
Step 3: Audit the Data Sources
The company reviews its CRM, marketing automation platform, advertising systems, and website analytics.
It identifies missing campaign parameters and inconsistent contact records.
Step 4: Select an Attribution Platform
The organization evaluates B2B-focused tools such as Dreamdata, HockeyStack, and Adobe Marketo Measure.
It prioritizes account-level analysis, CRM integration, and revenue reporting.
Step 5: Configure Tracking
Technical teams connect eligible data sources.
They establish consistent campaign naming, conversion definitions, and identity association rules.
Privacy requirements are reviewed before collecting or connecting personal data.
Step 6: Validate the Data
The team compares reported leads, opportunities, and revenue with the CRM.
It investigates duplicate records and missing interactions.
This helps reduce misleading attribution results.
Step 7: Compare Attribution Models
The company examines linear, position-based, and other relevant models.
Suppose educational webinars frequently appear early in journeys associated with qualified opportunities.
Paid search may appear closer to demo requests.
The team recognizes that these patterns describe recorded associations rather than proven causal effects.
Step 8: Analyze Account Segments
Researchers compare attribution results across company size, industry, and sales cycle length.
They examine whether different buying groups interact with different marketing activities.
Step 9: Validate Marketing Impact
The company conducts an appropriate experiment where feasible.
For example, it may test an incremental advertising investment among comparable market segments.
Experimental evidence helps evaluate whether the proposed investment produces additional outcomes.
Step 10: Improve Marketing Planning
Leadership combines attribution findings with experiments, pipeline trends, customer research, and financial constraints.
The company adjusts marketing priorities cautiously and monitors subsequent performance.
Common Mistakes to Avoid in Multi-touch Attribution
1. Treating Attribution Credit as Incremental Revenue
Attribution assigns credit according to rules or models.
It does not automatically establish causation.
2. Assuming the Entire Journey Is Observable
Offline interactions, privacy restrictions, and untracked devices create missing data.
Recognize these limitations.
3. Using Poor Campaign Naming
Inconsistent campaign parameters can fragment reports.
Establish standardized tracking conventions.
4. Ignoring CRM Data Quality
Incorrect opportunities, contacts, and revenue records can distort B2B attribution.
Maintain reliable sales data.
5. Choosing Models Without Understanding Assumptions
Different attribution models produce different credit allocations.
Understand what each model emphasizes.
6. Overlooking Identity Matching Errors
Incorrectly combining interactions can create misleading journeys.
Evaluate identity resolution methods.
7. Comparing Incompatible Attribution Windows
Different windows may produce different conversion counts.
Use consistent definitions when comparing results.
8. Ignoring Privacy and Consent
Data collection and identity association must comply with applicable requirements.
9. Optimizing Only for Credited Conversions
A channel may receive attribution credit without producing substantial incremental results.
Use complementary measurement methods.
10. Failing to Maintain Integrations
Broken tracking and disconnected systems can degrade attribution quality.
Monitor data pipelines regularly.
Frequently Asked Questions (FAQs)
1. What is multi-touch attribution?
Multi-touch attribution distributes conversion credit across multiple recorded marketing interactions.
2. What is a multi-touch attribution tool?
It is software that collects eligible marketing interactions, applies attribution models, and reports credited outcomes.
3. Why is multi-touch attribution important?
It provides broader visibility into recorded customer journeys than single-touch models.
4. What is linear attribution?
Linear attribution distributes credit equally across eligible touchpoints.
5. What is time-decay attribution?
Time-decay attribution gives more credit to interactions closer to conversion.
6. What is position-based attribution?
Position-based attribution emphasizes selected journey positions, often the first and last interactions.
7. What is W-shaped attribution?
W-shaped attribution emphasizes three selected B2B milestones, commonly first touch, lead creation, and opportunity creation.
8. What is full-path attribution?
Full-path attribution distributes credit across important stages of a longer customer journey.
9. What is data-driven attribution?
Data-driven attribution uses statistical or algorithmic methods to allocate credit based on observed patterns.
10. How is multi-touch attribution different from last-click attribution?
Last-click attribution assigns all credit to the final eligible interaction.
Multi-touch attribution distributes credit across several interactions.
11. Can multi-touch attribution measure offline marketing?
Some platforms support eligible offline interactions when suitable data is available.
12. Does multi-touch attribution require cookies?
Some implementations use cookies or other identifiers, but available methods depend on the platform and privacy environment.
13. What is account-based attribution?
Account-based attribution examines interactions associated with business accounts.
14. Can multi-touch attribution connect marketing with revenue?
Yes. Platforms with appropriate CRM or commerce integrations can associate eligible interactions with revenue outcomes.
15. Is multi-touch attribution suitable for B2B companies?
Yes. It is particularly relevant to organizations with long sales cycles and multiple buying stakeholders.
16. Can e-commerce businesses use multi-touch attribution?
Yes. E-commerce platforms can analyze recorded interactions associated with purchases.
17. What is an attribution window?
An attribution window defines the period during which eligible interactions may receive credit.
18. Why do attribution models produce different results?
They use different rules or methods for distributing credit.
19. Can AI improve multi-touch attribution?
AI can support modeling and analysis, but outputs remain dependent on available data and assumptions.
20. What is identity resolution?
Identity resolution attempts to associate relevant interactions with the same individual or account.
21. What is revenue attribution?
Revenue attribution connects eligible marketing interactions with recorded sales outcomes.
22. Can multi-touch attribution prove marketing incrementality?
No. Attribution alone does not establish what would have happened without the marketing activity.
23. How does MMM differ from multi-touch attribution?
MMM generally uses aggregated historical data and statistical modeling.
Multi-touch attribution examines recorded interactions associated with conversions.
24. Should businesses use MMM and attribution together?
Yes, when appropriate. They provide complementary perspectives.
25. Can multi-touch attribution measure content marketing?
It can examine recorded content interactions associated with conversions.
26. What are the main limitations of multi-touch attribution?
Limitations include missing interactions, privacy restrictions, identity errors, model assumptions, and incomplete causal evidence.
27. How often should attribution reports be reviewed?
Review frequency depends on campaign activity, business needs, and data availability.
28. Can small businesses use multi-touch attribution?
Yes. Smaller businesses can begin with suitable analytics tools and expand as measurement needs become more complex.
29. What is the best multi-touch attribution tool for B2B SaaS?
Dreamdata, HockeyStack, and Adobe Marketo Measure are relevant options depending on requirements.
30. How should businesses choose a multi-touch attribution platform?
Evaluate customer journeys, conversion outcomes, data sources, integrations, attribution methods, privacy requirements, reporting, and total cost.
Final Thoughts
Multi-touch attribution tools help organizations understand how recorded marketing interactions relate to customer acquisition, pipeline, and revenue.
Dreamdata, HockeyStack, Adobe Marketo Measure, and Factors.ai are particularly relevant to B2B marketing environments.
Ruler Analytics supports lead-generation and revenue attribution, while Wicked Reports focuses on revenue-oriented customer journeys.
Northbeam and Triple Whale provide attribution capabilities relevant to e-commerce brands.
Google Analytics 4 and Adobe Analytics support broader digital customer journey analysis.
The best platform depends on the organization’s business model, measurement objectives, customer journey, data quality, and analytical requirements.
Multi-touch attribution should not be treated as a perfect representation of customer behavior or as definitive evidence of marketing causality.
Reliable measurement requires consistent tracking, appropriate identity practices, careful model interpretation, and validation through complementary methods.
When used responsibly, multi-touch attribution can help organizations identify meaningful journey patterns, improve marketing reporting, and make more informed investment decisions.
