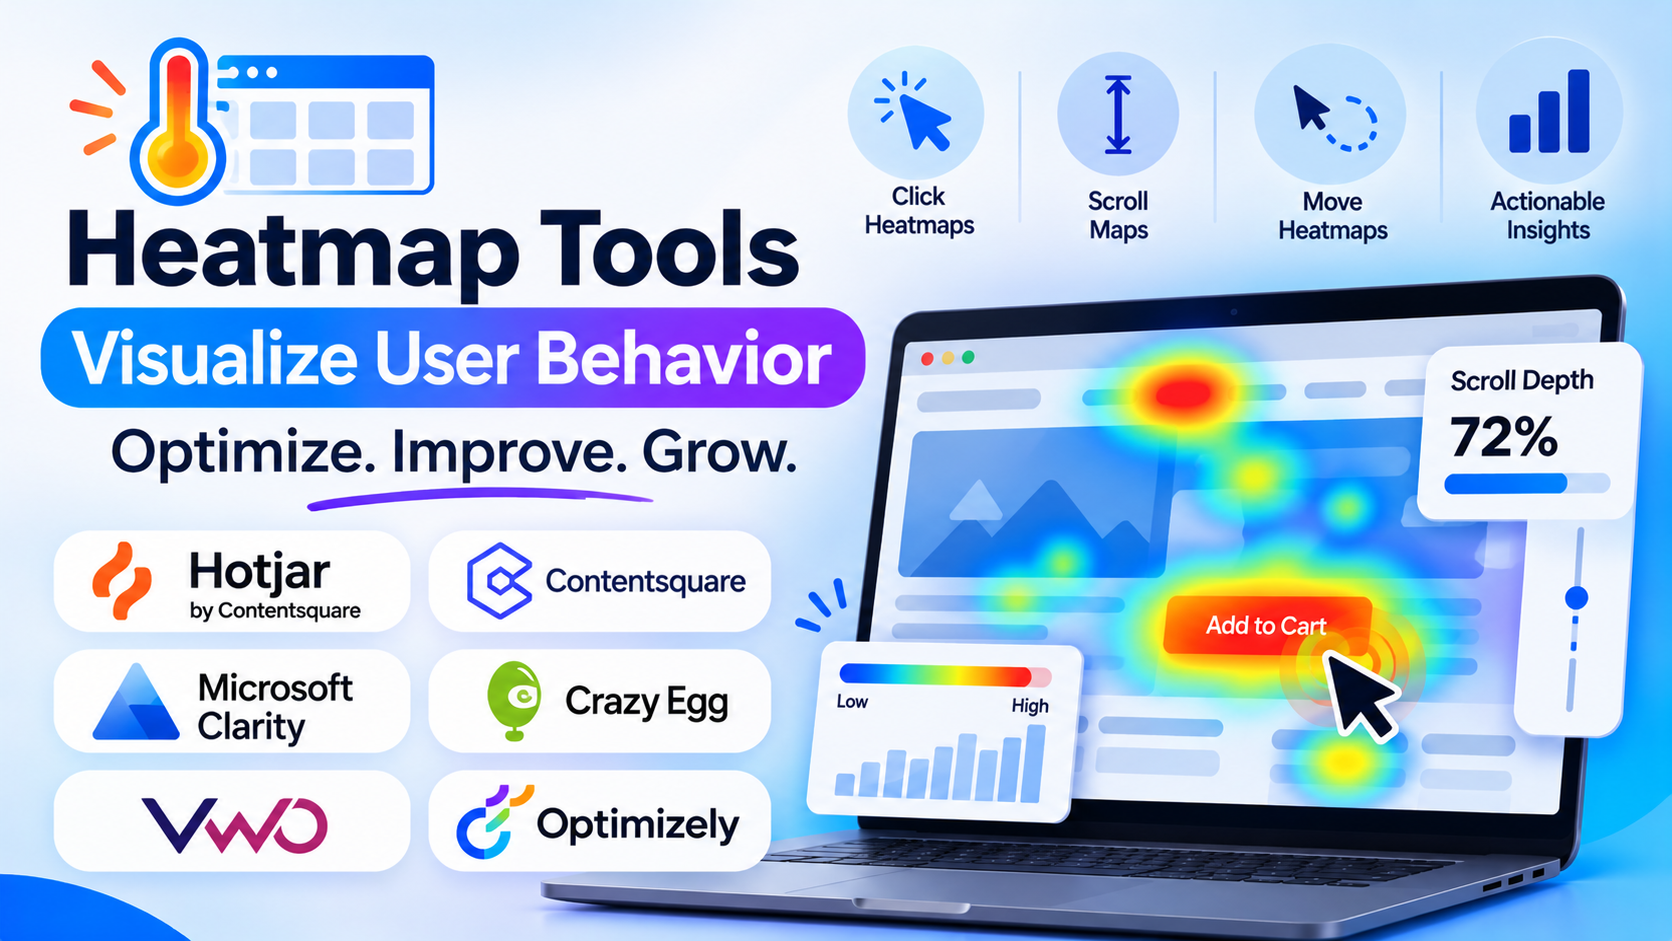
A single user’s path can be an anomaly; aggregate behavioral patterns reveal systemic design failures. When visitors repeatedly click an unlinked product image expecting a gallery, abandon a long registration form halfway down the page, or completely miss your primary Call-to-Action (CTA) button because it sits below the average mobile fold line, traditional analytics spreadsheets will only report a low conversion rate—leaving designers guessing which on-page elements caused the drop-off.
Heatmap tools translate thousands of individual browsing sessions into intuitive visual heat representations—aggregating clicks, cursor movements, vertical scroll depth, and form field drop-offs directly across your live web pages. Evaluating heatmap software requires distinguishing between dedicated conversion optimization and heatmap suites, all-in-one product analytics engines with visual overlays, and lightweight click-tracking plugins.
Five Core Capabilities of Modern Heatmap Platforms
Modern heatmaps go far beyond generating a static screenshot with colored dots; production heatmap platforms provide five technical capabilities:
- Multi-State Dynamic Element and SPA Handling: Capturing heatmaps accurately across modern Single Page Applications (React, Vue, Angular) and dynamic UI states—rendering user clicks correctly across open modals, collapsible accordions, sticky headers, and responsive drop-down menus rather than flattening them onto a static background.
- Multi-Device and Responsive Viewport Segmentation: Visualizing aggregate user interactions separately across exact desktop, tablet, and mobile viewport breakpoints—revealing how responsive layout shifts alter where user attention falls on mobile devices.
- Scroll Depth and Average Fold Line Analytics: Calculating precise vertical scroll drop-off percentages—showing exactly what percentage of visitors scroll past 25%, 50%, or 75% of the page, accompanied by a dynamic visual line marking the average screen fold.
- Form Field Analytics and Hesitation Tracking: Analyzing interactive web forms at the field level—identifying fields that cause the highest abandonment rates, take the longest to fill out, or trigger repeated validation error corrections.
- Session Replay and Funnel Integration: Enabling teams to click directly on an unexpected cluster of rage clicks on a heatmap and instantly launch the underlying session recordings of those exact users to understand the root cause of the friction.
Leading Heatmap Tools
Hotjar (by Contentsquare)
Hotjar is the industry benchmark for visual website optimization, trusted by millions of sites for its accessible, clean, and intuitive approach to user behavior analytics. Combining click heatmaps, move heatmaps (cursor tracking), and scroll heatmaps with session replays, on-site feedback polls, and user interview recruitment, Hotjar provides continuous, aggregate visual analysis that non-technical marketers, UX designers, and product managers can master in minutes.
Marketing teams, e-commerce managers, and conversion rate optimization (CRO) specialists seeking fast implementation, clean visual reports, and built-in user survey feedback standardize heavily on Hotjar.
Contentsquare
Contentsquare is an enterprise-grade digital experience analytics titan built for high-volume multinational retailers, telecommunications providers, and global financial services institutions. Moving far beyond basic click maps, Contentsquare offers Zoning Analysis—measuring the revenue contribution, conversion rate, and engagement score of every individual page element, button, and banner.
Large enterprise e-commerce platforms and multi-brand corporate operations requiring deep financial attribution per page element, complex mobile app SDK tracking, and AI-driven merchandising insights favor Contentsquare, accepting enterprise-level pricing and implementation requirements.
Microsoft Clarity
Microsoft Clarity has disrupted the heatmap and behavior analytics market by offering a completely free, enterprise-scale platform with zero traffic limits, zero sampling, and no paid tiers. Backed by Microsoft, Clarity provides real-time click heatmaps, scroll depth tracking, session recordings, and automated behavioral insights (such as rage clicks, excessive scrolling, and dead clicks) without capping pageviews.
Startups, high-traffic content publishers, and budget-conscious enterprises that want reliable visual heatmaps and session recordings without monthly subscription fees or traffic caps rely heavily on Microsoft Clarity.
Crazy Egg
Crazy Egg is one of the original pioneers of web heatmap technology, known for its distinctive Confetti report—which breaks down individual clicks by referral source, browser, operating system, and campaign UTM parameters. Crazy Egg combines heatmaps, scroll maps, session recordings, and a built-in A/B testing tool, allowing marketers to spot design flaws and immediately test alternative layouts without leaving the platform.
Small-to-mid-sized business marketers, landing page designers, and conversion specialists who value traffic-segmented click data and native A/B testing favor Crazy Egg.
VWO and Optimizely (Experimentation Platforms With Native Heatmaps)
When visual heatmaps are used primarily as the diagnostic foundation for structured conversion experiments, dedicated experimentation platforms provide native visual tracking:
- VWO (Visual Website Optimizer) integrates dynamic heatmaps, session recordings, and form analytics directly into its enterprise A/B testing and personalization suite—letting optimization teams diagnose page friction and launch visual split tests in a single workflow.
- Optimizely provides visual analytics overlays connected to its enterprise feature experimentation and digital experience platform.
Heatmap Tools Comparison
| Platform | Primary Market Role | Dynamic SPA & Modal Handling | Unique Analytical Strength | Pricing & Traffic Limits | Best Fit |
| Hotjar | Unified visual behavior & feedback platform | High (Continuous heatmaps across dynamic states) | Seamless integration with user surveys & session replays | Tiered monthly plans (Based on daily session limits) | Marketers, UX designers & mid-market e-commerce sites |
| Contentsquare | Global enterprise digital experience analytics | Very High (Enterprise multi-state zoning & mobile SDKs) | Element-level revenue & conversion attribution (Zoning) | Enterprise annual contract pricing | Fortune 500 retailers, global brands & high-volume e-commerce |
| Microsoft Clarity | Free, unlimited visual analytics & replay | High (Handles modern responsive layouts cleanly) | Zero traffic caps, no sampling & automated AI insights | 100% Free (No traffic caps or paid tiers) | High-traffic sites, startups & budget-conscious teams |
| Crazy Egg | CRO heatmap & landing page testing tool | Moderate–High (Visual click & scroll tracking) | Confetti reports (Segmenting clicks by traffic source/UTM) | Tiered monthly subscription plans | Growth marketers, landing page builders & conversion agencies |
| VWO | Full-scale CRO experimentation & heatmap platform | High (Integrates dynamic overlays across test variants) | Instant translation from heatmap friction into live A/B tests | Tiered platform plans (Based on monthly tested users) | Dedicated optimization teams running continuous A/B test programs |
Common Heatmap Implementation Pitfalls to Avoid
- Evaluating Heatmaps on Low-Traffic Pages Without Statistical Significance: Generating a heatmap from only 45 visitors produces misleading scatter plots that reflect personal idiosyncrasies rather than actionable user behavior. Ensure a page gathers at least 1,000 to 2,000 visits across a specific viewport breakpoint before drawing design conclusions.
- Aggregating Desktop and Mobile Clicks Into a Single View: Combining touch taps from a vertical smartphone screen with mouse clicks from a widescreen desktop monitor creates distorted data. Always analyze mobile, tablet, and desktop heatmaps independently.
- Focusing Exclusively on Clicks While Ignoring Scroll Drop-Off: A primary CTA button with high click density looks successful until a scroll map reveals that only 18% of site visitors ever scroll far enough down the page to see the button. Align placement with natural fold lines.
Selecting the Right Heatmap Tool
Match your heatmap software to your traffic volume, experimentation maturity, and budget:
- For Zero-Cost, High-Scale Heatmaps and Session Recordings: Deploy Microsoft Clarity for unlimited tracking without subscription costs or sampling caps.
- For Fast Qualitative Discovery Paired With Customer Feedback Polls: Standardize on Hotjar for an intuitive, marketer-friendly user experience.
- For Enterprise E-Commerce Requiring Element-Level Revenue Attribution: Choose Contentsquare for deep merchandising analytics and financial zoning insights.
- For Conversion Rate Optimization Teams Running Continuous Split Tests: Integrate VWO to diagnose friction and deploy A/B test variations within a single platform.
- For Granular Traffic-Source Click Attribution on Landing Pages: Use Crazy Egg to leverage its Confetti reports.
