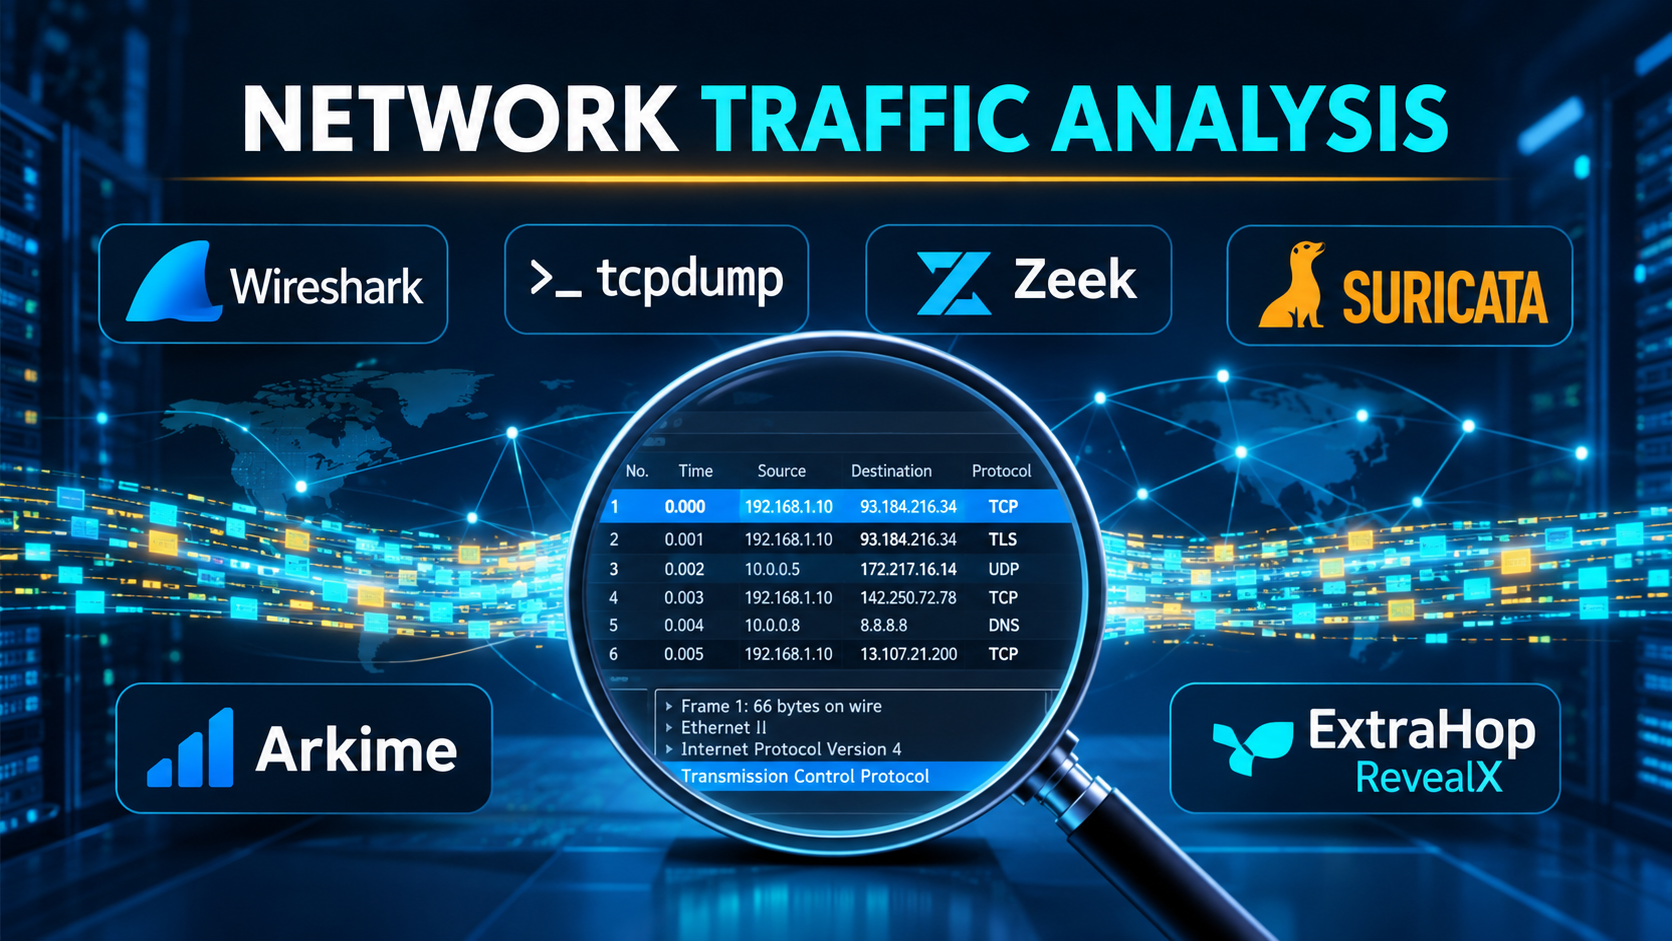
When an application intermittently drops database connections or suffers asymmetric TLS handshake delays, high-level SNMP interface counters only confirm that packets are moving. Resolving the root cause requires looking inside the wire—inspecting TCP sequence numbers, window scaling, DNS resolution timeouts, malformed application headers, and East-West traffic anomalies.
Network analysis tools operate at a deeper inspection layer than standard uptime or device-polling monitors. However, the category spans distinct operational modes: interactive packet-capture workstations built for deep single-stream protocol dissection, headless command-line sniffers for remote Linux servers and containers, continuous network security monitoring (NSM) engines that transform live wire traffic into structured metadata logs, and enterprise packet-broker and Network Detection and Response (NDR) appliances. Selecting the right tool requires balancing packet-capture throughput, storage retention economics, TLS decryption boundaries, and investigative workflow speed.
Four Technical Approaches to Network Traffic Analysis
Before comparing individual tools, network engineers, security analysts, and SREs should separate the four operational architectures used to capture and inspect wire data.
1. Interactive Graphical Packet Analyzers
Desktop applications such as Wireshark read live network interfaces or offline .pcap / .pcapng capture files, applying thousands of protocol dissectors to decode Ethernet, IP, TCP/UDP, TLS, HTTP/2, gRPC, DNS, and industrial protocols frame by frame.
- Core strength: Unmatched protocol-level granularity for troubleshooting complex retransmissions, handshake failures, and custom binary protocols.
- Primary trade-off: Designed for human-driven deep inspection of bounded capture files rather than multi-terabyte, 24/7 continuous enterprise traffic retention.
2. Headless CLI Packet Sniffers and Kernel Filters
Command-line utilities like tcpdump, tshark, and termshark run directly on production Linux hosts, routers, and Kubernetes pods using Berkeley Packet Filter (BPF) expressions to capture or summarize traffic over SSH without a graphical desktop.
- Core strength: Immediately available across Unix-like environments with minimal resource footprint when isolating an active production fault.
- Primary trade-off: Unfiltered captures on 10GbE+ interfaces rapidly fill local disks and drop packets unless tightly scoped with BPF filters and ring-buffer limits.
3. Continuous Metadata Extraction and Security Monitors (NSM)
Engines such as Zeek and Suricata sit passively on network SPAN ports, optical TAPs, or cloud traffic-mirroring feeds—converting high-speed raw packet streams into compact, structured JSON/TSV transaction logs (connection summaries, DNS queries, HTTP headers, X.509 certificates, and extracted files) rather than storing every full packet payload indefinitely.
- Core strength: Retains months of searchable network forensics across multi-gigabit links at a fraction of the storage cost of full packet capture (PCAP).
- Primary trade-off: Summarizes protocol transactions rather than preserving every raw payload byte for post-hoc binary replay.
4. Enterprise Continuous Packet Capture and NDR Platforms
Commercial suites such as ExtraHop RevealX, Riverbed AppResponse, and Darktrace / Vectra AI combine wire-speed appliance/cloud capture with automated application-performance baselining, anomalous lateral-movement detection, and retrospective PCAP extraction.
Notable Network Analysis Tools Across Workflows
Wireshark — The Universal Protocol Dissection Benchmark
Maintained as an open-source project under the Wireshark Foundation, Wireshark is the definitive graphical protocol analyzer for network engineers, security researchers, and application developers. Supporting hundreds of capture file formats and thousands of built-in protocol dissectors, Wireshark reconstructs TCP streams, visualizes sequence/acknowledgment timing graphs (tcptrace), decrypts TLS sessions when supplied with pre-master secret logs (SSLKEYLOGFILE), and flags TCP retransmissions, duplicate ACKs, and zero-window stalls automatically.
Wireshark runs across Windows, macOS, and Linux, and pairs naturally with remote capture pipelines (sshdump, ciscodump) so engineers can inspect live traffic from remote Linux servers or network appliances on a local workstation. Its limitation is scale: opening multi-gigabyte PCAP files in a single desktop GUI strains system memory, requiring pre-filtering with editcap or tshark first.
tcpdump and tshark — Essential Headless Capture and Pipeline Scripting
When an outage occurs on a remote container host or bastion server where running a GUI is impossible, tcpdump and tshark (Wireshark’s terminal-based sibling) are indispensable:
tcpdumprelies onlibpcapand compiled BPF bytecode to capture packets at minimal CPU overhead, supporting ring-buffer rotation (-Cand-Wflags) so continuous captures never exhaust root filesystem storage.tsharkbrings Wireshark’s full library of protocol dissectors and display filters (-Y) to the command line—allowing engineers to extract specific fields (-T fields -e dns.qry.name -e http.response.code) into CSV or JSON for automated log pipelines without saving full packet payloads.
Zeek (formerly Bro) — Open-Source Network Security Monitoring and Traffic Forensics
Hosted under Corelight’s open-source stewardship, Zeek transforms passive network traffic into rich, structured, high-level semantic logs (conn.log, dns.log, ssl.log, http.log, files.log). Rather than functioning purely as a signature-based intrusion alarm, Zeek provides an event-driven scripting language that lets security and network teams write custom protocol analyzers, detect beaconing behavior, track expired TLS certificates across internal subnets, and feed structured telemetry into Elasticsearch, Splunk, or SIEM platforms.
Zeek excels at long-term network forensics and threat hunting across high-bandwidth enterprise links, though deploying it effectively at multi-gigabit speeds requires dedicated sensor hardware with NIC packet-ring acceleration (such as AF_PACKET, PF_RING, or DPDK) and TAP/SPAN visibility.
Suricata — High-Performance Multi-Threaded IDS/IPS and Protocol Logging
Developed by the Open Information Security Foundation (OISF), Suricata is an open-source, multi-threaded network threat detection and protocol analysis engine. Unlike single-threaded legacy packet inspectors, Suricata leverages modern multi-core CPUs and hardware acceleration to inspect traffic at multi-gigabit line rates—combining signature-based rule matching (Emerging Threats / Snort rulesets) with structured EVE JSON protocol logging and automatic file extraction.
Many enterprise security architectures deploy Zeek and Suricata side by side: Suricata handles real-time signature alerting and inline prevention, while Zeek provides deep behavioral connection logs.
Arkime (formerly Moloch) — Large-Scale Indexed Full Packet Capture (PCAP)
Originally created at AOL and maintained as an open-source project, Arkime solves the problem of storing, indexing, and searching full PCAP data across large enterprise networks. Arkime captures wire-speed traffic, indexes session metadata inside OpenSearch or Elasticsearch, and stores raw compressed PCAP files on local disk—allowing analysts to search historical sessions via a web UI and download exact PCAP slices directly into Wireshark.
Arkime bridges the gap between ephemeral CLI captures and expensive proprietary enterprise packet-capture appliances, provided the operations team allocates sufficient high-throughput disk storage and OpenSearch indexing capacity.
ExtraHop RevealX — Real-Time Wire-Data Analytics and Cloud NDR
ExtraHop RevealX is a commercial enterprise network detection and response (NDR) and network performance platform that analyzes wire data across on-premises data centers and cloud traffic-mirroring feeds (AWS VPC Traffic Mirroring, Azure vTAP, GCP Packet Mirroring).
ExtraHop reassembles Layer 2 through Layer 7 transactions in real time—identifying unencrypted sensitive data transfers, anomalous lateral East-West movement, and specific database/storage protocol latency without installing host agents. Its commercial enterprise pricing and sensor architecture suit mid-to-large enterprises seeking automated behavioral analytics rather than manual PCAP troubleshooting.
termshark and ngrep — Lightweight Developer Utilities for Rapid Triage
For developers and SREs debugging microservices directly in terminal sessions:
termsharkwrapstsharkin a terminal-based user interface (TUI) modeled on Wireshark’s three-pane layout, letting engineers inspect packet trees and reassembled TCP streams directly over SSH.ngrepapplies standard regular expressions directly against network packet payloads, making it fast for verifying plaintext HTTP headers, SIP signaling, or internal unencrypted RPC payloads during staging tests.
Comparison of Network Analysis Tools
| Tool / Platform | Primary Inspection Level | Capture & Storage Model | Interface & Workflow | Standout Strength | Primary Trade-Off |
| Wireshark | Frame-by-frame L2–L7 protocol dissection | Live interface or local .pcap/.pcapng files | Cross-platform desktop GUI | Deepest protocol dissector library and TCP stream timing diagnostics | Not designed for 24/7 continuous multi-terabyte enterprise retention |
tcpdump / tshark | Kernel BPF packet capture & CLI dissection | Live NIC capture to rotating PCAP or stdout | Headless CLI (Linux/BSD/macOS) | Low-overhead remote capture on production servers and containers | Requires strong BPF filter discipline to avoid disk saturation or packet drops |
| Zeek | Passive semantic protocol & session logging | Extracts structured JSON/TSV logs from live TAP/SPAN | Headless sensor + SIEM ingestion | Compact, searchable long-term traffic forensics without full PCAP storage | Does not store raw full packet payloads by default |
| Suricata | Multi-threaded signature IDS/IPS & EVE JSON logs | Live inline or passive TAP/SPAN inspection | Headless multi-core engine + SIEM | High-throughput multi-core rule inspection paired with structured protocol logs | Rule tuning required to suppress false-positive security alerts |
| Arkime | Indexed full packet capture (PCAP) retention | Raw PCAP on disk + OpenSearch session metadata | Web UI + PCAP export to Wireshark | Makes multi-terabyte historical PCAP collections searchable in seconds | Demands substantial high-speed storage and OpenSearch cluster sizing |
| ExtraHop RevealX | Real-time L2–L7 wire-data analytics & NDR | Cloud traffic mirroring & hardware/virtual sensors | Commercial enterprise SaaS / appliance UI | Agentless lateral-movement detection and application-layer wire latency | Enterprise commercial licensing and network TAP/mirroring prerequisites |
Four Operational Realities in Packet and Traffic Analysis
1. Ubiquitous TLS 1.3 Encryption Changes Inspection Boundaries
With TLS 1.3 and Perfect Forward Secrecy (PFS) standard across internal and external services, passive network sniffers can no longer decrypt captured traffic simply by holding a server’s static RSA private key. In controlled debugging environments, developers can configure runtimes (OpenSSL, Go, Chrome, Firefox, curl) to export ephemeral session keys via SSLKEYLOGFILE for Wireshark decryption—while production cloud architectures increasingly pair passive wire metadata (SNI, JA4 fingerprints, TCP handshake timing) with eBPF socket-level tracing before encryption occurs.
2. Cloud VPC Traffic Mirroring Carries Bandwidth Costs
Capturing packets in AWS, Google Cloud, or Azure requires configuring VPC Traffic Mirroring or Packet Mirroring to duplicate ENI traffic toward a collector appliance. Remember that mirrored traffic traverses your virtual network interfaces—meaning heavy East-West mirroring can count toward inter-AZ data-transfer charges and ENI throughput limits unless scoped tightly with ingress/egress filters.
3. Always Filter at Capture Time, Not Just Display Time
Running tcpdump -i eth0 -w full.pcap on a busy database node without a Berkeley Packet Filter (host 10.0.1.45 and port 5432) captures massive volumes of unrelated health checks and replication traffic, causing kernel ring-buffer drops that invalidate TCP sequence analysis. Always apply narrow BPF capture filters (tcpdump) before using display filters (Wireshark) for deeper inspection.
4. Ring Buffers Protect Production Disks
When waiting to catch an intermittent network glitch that occurs once every few hours, configure rotating ring buffers (for example, tcpdump -i any -C 100 -W 10 -w capture.pcap) so the capture continuously overwrites ten 100 MB files rather than filling the root partition and crashing the host.
Choosing the Right Network Analysis Tool
- For troubleshooting complex protocol bugs, TCP retransmissions, and TLS handshakes: Use
tcpdumpwith ring buffers on the remote host to capture targeted PCAPs, and inspect them locally in Wireshark (ortermsharkdirectly over SSH). - For continuous, cost-effective network security visibility and long-term traffic forensics: Deploy Zeek and Suricata on network TAPs or cloud traffic mirrors, shipping structured JSON logs into OpenSearch, Splunk, or Grafana Loki.
- For organizations needing searchable, multi-day full packet capture retention: Arkime pairs raw PCAP storage with fast web-based session indexing.
- For large enterprises seeking agentless East-West threat detection and wire-level application latency analytics: ExtraHop RevealX provides automated behavioral intelligence across hybrid and cloud networks.
