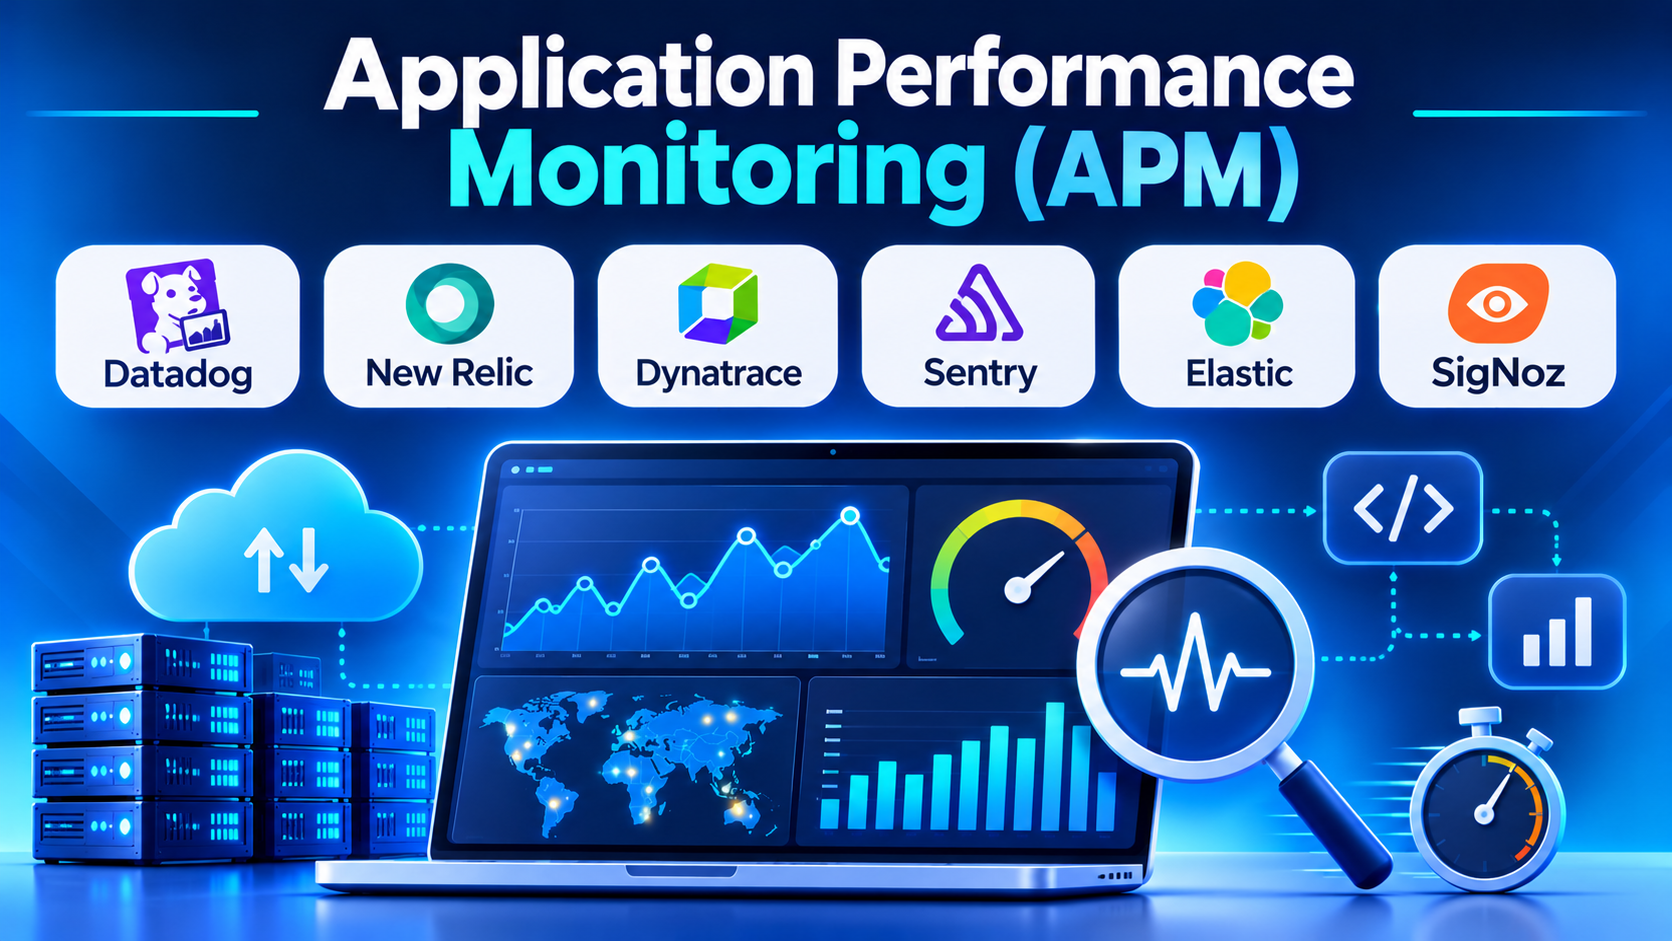
A sudden p99 latency spike during checkout rarely announces whether the culprit is an unindexed SQL query, thread-pool starvation in a downstream microservice, garbage-collection pauses in the JVM, or a slow third-party payment webhook. Standard infrastructure metrics—CPU, memory, and network throughput—only confirm that a server is busy; they cannot explain why a specific user transaction took four seconds to complete.
Application Performance Monitoring (APM) tools close that visibility gap by instrumenting application runtimes, tracing distributed requests across service boundaries, and profiling method-level execution. However, evaluating APM platforms requires navigating sharper trade-offs than marketing feature lists suggest. Automatic bytecode injection simplifies onboarding but can introduce measurable CPU overhead and vendor lock-in, whereas OpenTelemetry-based pipelines preserve portability while shifting instrumentation ownership onto engineering teams.
Three Instrumentation Mechanisms Behind Modern APM
Before comparing specific products, engineering and SRE teams should understand how an APM tool actually observes running code—because the instrumentation mechanism governs setup effort, runtime overhead, and diagnostic depth.
1. Automatic Runtime Bytecode and Monkey-Patch Instrumentation
Traditional APM agents hook directly into language runtimes—using JVM -javaagent flags, .NET CLR profiling APIs, or Python/Node.js module-wrapping hooks—to automatically trace incoming HTTP routes, database drivers, message queues, and external HTTP clients without modifying application source code.
- Core strength: Rapid deployment across existing applications with deep method-level flame graphs, SQL query plans, and exception stack traces out of the box.
- Primary trade-off: Can create subtle runtime overhead, version conflicts during language runtime upgrades, and tight coupling to a vendor’s proprietary agent configuration.
2. OpenTelemetry (OTel) Native SDKs and Auto-Instrumentation
OpenTelemetry provides vendor-neutral APIs, SDKs, and zero-code instrumentation agents that emit standardized traces, metrics, and logs over the OpenTelemetry Protocol (OTLP) to any compatible backend.
- Core strength: Eliminates vendor lock-in, allows teams to enrich spans with custom business attributes (
tenant_id,cart_value), and routes data through an OpenTelemetry Collector for centralized sampling and PII scrubbing. - Primary trade-off: Requires engineering teams to manage SDK versions, context propagation across custom async workers, and collector pipelines rather than relying on a single vendor agent.
3. Kernel-Level eBPF Zero-Code Profiling
eBPF-based APM engines (such as Grafana Beyla, Parca, Pixie, and Polar Signals) attach probes directly inside the Linux kernel to observe network protocols (HTTP, gRPC, SQL, Redis) and CPU stack samples across every container on a host without injecting agents into individual application processes.
- Core strength: Near-zero instrumentation friction across polyglot Kubernetes clusters and continuous CPU profiling with minimal runtime overhead.
- Primary trade-off: Provides less visibility into application-internal business logic, encrypted TLS payloads (unless intercepted at library boundaries), and language-specific managed heap internals compared to in-process runtime agents.
Notable Application Performance Monitoring Platforms Across Workflows
Datadog APM — Deep Distributed Tracing and Continuous Profiling
Datadog APM combines distributed tracing, code-level continuous profiling, database monitoring (DBM), and real-user monitoring (RUM) inside a unified commercial SaaS platform. Engineers can pivot seamlessly from a slow frontend browser session to the exact backend trace span, inspect the underlying PostgreSQL or MySQL execution plan, and view CPU/memory flame graphs down to the specific line of code.
Datadog supports both its proprietary dd-trace libraries and native OpenTelemetry ingestion. Its primary operational consideration is cost management: billing combines per-APM-host fees with ingested and indexed trace span volumes, making intelligent head- and tail-based sampling rules essential on high-throughput services.
Dynatrace — Zero-Touch Enterprise Discovery and Automated Root-Cause Analysis
Dynatrace is engineered for large, complex enterprise estates spanning Kubernetes, hybrid cloud VMs, and legacy middleware. Its OneAgent binary installs once per host or cluster node, automatically detecting running processes, injecting runtime instrumentation across Java, .NET, Node.js, Go, and PHP, and constructing a real-time dependency topology map (Smartscape).
Rather than forcing engineers to configure static threshold alerts manually, Dynatrace’s Davis AI engine analyzes dependency graphs and baseline telemetry deterministically to isolate the exact root cause of multi-service incidents. Dynatrace excels in organizations with large application portfolios where manual code instrumentation is impractical, though its enterprise licensing model and agent-centric architecture carry higher cost and stronger vendor coupling than OpenTelemetry-first tools.
New Relic APM — Unified Telemetry Querying and Ingest-Based Pricing
New Relic provides comprehensive code-level APM across major backend and mobile runtimes, pairing automatic transaction tracing, thread profiling, and external service maps with browser and mobile RUM.
Its standout differentiator is its unified telemetry backend (NRDB) and SQL-like query language (NRQL), which lets developers query transaction traces alongside infrastructure metrics and application logs without switching data silos. Because New Relic prices primarily on total gigabytes ingested and full-platform user seats rather than charging separate per-host APM taxes, teams running dense microservice fleets on Kubernetes often find its cost structure easier to forecast.
AppDynamics (Cisco) — Business Transaction Mapping for Hybrid Enterprises
AppDynamics organizes application performance around Business Transactions—tracking end-to-end user journeys (such as “Login,” “Search Catalog,” or “Submit Payment”) across distributed tiers, legacy monoliths, and enterprise databases.
It automatically establishes dynamic performance baselines for each business transaction and correlates application latency with underlying database and network health (integrating with Cisco ThousandEyes for internet and WAN path visibility). AppDynamics remains heavily entrenched in large financial, retail, and telecommunications enterprises running traditional JVM and .NET workloads, though cloud-native startups generally favor lighter, OpenTelemetry-native platforms.
Elastic APM — Search-Powered Tracing for Elasticsearch-Centric Stacks
Built directly on top of Elasticsearch and Kibana, Elastic APM captures distributed traces, code-level spans, runtime JVM/.NET/Python metrics, and eBPF continuous profiling inside the same search cluster teams use for centralized log analytics.
For organizations already operating Elastic Cloud or self-managed Elasticsearch clusters, Elastic APM avoids introducing a separate vendor contract and enables instant correlation between slow trace transactions and surrounding unstructured application logs. Teams not already invested in Elasticsearch should account for the storage and memory sizing required to retain high-volume trace indices.
Sentry — Developer-Centric Error Tracking Paired with Performance Tracing
Originally focused on real-time exception and crash reporting, Sentry has expanded into lightweight, developer-first APM—connecting frontend browser/mobile performance (Web Vitals, cold app starts, slow screen renders) directly to backend distributed traces and slow database queries.
Sentry prioritizes actionable developer diagnostics—linking slow endpoints directly to Git commit authors, suspect commits, and stack traces—rather than heavyweight infrastructure capacity planning. It is an especially strong fit for product engineering teams seeking fast feedback on application regressions without deploying enterprise operations suites.
Open-Source APM Alternatives (Apache SkyWalking, SigNoz, Jaeger + Prometheus)
Organizations seeking self-hosted control or zero per-host licensing fees have mature open-source options:
- Apache SkyWalking provides a full-featured, open-source APM platform with auto-instrumenting agents (Java, .NET, Node.js, Python, Go, PHP), service topology maps, and native eBPF profiling.
- SigNoz pairs native OpenTelemetry ingestion with a ClickHouse backend to deliver APM metrics (p50/p95/p99 latency, error rates, throughput), flame-graph trace views, and log correlation in a single open-source UI.
- Jaeger (for distributed tracing) paired with Prometheus and Grafana remains the modular CNCF baseline when platform teams prefer assembling best-of-breed open-source components.
Comparison of Application Performance Monitoring Tools
| Platform / Tool | Instrumentation Approach | Deployment Model | Standout Strength | Primary Trade-Off |
| Datadog APM | Proprietary agents + native OpenTelemetry | Managed Cloud SaaS | Deep code profiling, database query plans, and RUM correlation in one UI | Multi-meter billing (hosts + indexed spans) requires strict sampling rules |
| Dynatrace | OneAgent auto-discovery + OpenTelemetry | Managed SaaS or Self-Hosted | Zero-code enterprise discovery and deterministic topology root-cause analysis | Higher enterprise pricing and stronger proprietary agent coupling |
| New Relic APM | Language agents + native OpenTelemetry | Managed Cloud SaaS | Predictable per-GB data-ingest pricing and flexible NRQL querying | Full-user seat costs can add up across large engineering organizations |
| AppDynamics (Cisco) | Bytecode runtime agents | Managed SaaS or On-Premises | Business-transaction baseline modeling and legacy enterprise stack depth | Heavier administrative setup; less agile for ephemeral cloud-native workflows |
| Elastic APM | Elastic agents + OpenTelemetry + eBPF | Self-Hosted or Elastic Cloud | Seamless correlation with high-volume Elasticsearch logs and SIEM data | Requires careful Elasticsearch cluster sizing for trace index retention |
| Sentry | Lightweight SDKs + OpenTelemetry | Managed SaaS or Self-Hosted | Tight developer workflow linking slow traces directly to exceptions and Git commits | Focused on application code rather than deep host/network infrastructure monitoring |
| Apache SkyWalking / SigNoz | Auto-agents, eBPF, & OpenTelemetry | Self-Hosted (Open Source) | Full APM service maps, latency percentiles, and tracing with zero license fees | Platform team owns storage scaling, upgrades, and high availability |
Four Technical Checks Before Selecting an APM Tool
1. Measure Real Overhead Under Peak Load
Every in-process APM agent adds CPU and memory overhead—typically modest on routine traffic, but potentially significant on tight, low-latency loops or high-frequency microservices. Benchmark candidate agents in a staging load test matching peak production requests per second, checking specifically for garbage-collection pauses and tail-latency (p99) degradation.
2. Verify Context Propagation Across Asynchronous Boundaries
HTTP header propagation (W3C Trace Context) works automatically across standard REST and gRPC calls, but traces frequently break across message brokers (Kafka, RabbitMQ, SQS), background worker pools, and reactive event loops. Test whether your candidate APM maintains unbroken parent-child spans across your exact async messaging architecture.
3. Scrutinize PII Scrubbing and Payload Capture Defaults
Code-level APM agents can inadvertently capture sensitive parameters inside SQL query literals, HTTP query strings, or exception local variables. Verify that the agent supports client-side parameter redaction before telemetry leaves your production network.
4. Model Sampling Strategy Before Signing a Contract
Capturing 100% of traces at scale is rarely economical. Confirm whether the platform supports tail-based sampling—retaining 100% of 5xx errors and slow latency outliers while sampling healthy 200 OK requests at a low percentage—so cost controls never blind you during an active outage.
Choosing the Right APM Strategy
- For cloud-native product teams wanting rapid cross-stack visibility: Datadog APM or New Relic delivers immediate transaction tracing, database insights, and frontend correlation—favoring New Relic when predictable per-GB ingest pricing outweighs per-host billing.
- For large enterprises managing complex hybrid and legacy estates with limited developer instrumentation bandwidth: Dynatrace (or AppDynamics in Cisco-aligned enterprises) automates service discovery and root-cause isolation at scale.
- For developer-led teams already using error tracking who want lightweight performance visibility: Sentry connects slow endpoints directly to code regressions without separate ops tooling.
- For engineering organizations prioritizing OpenTelemetry portability and self-hosted cost control: Standardize on OpenTelemetry SDKs feeding SigNoz or Apache SkyWalking, keeping your instrumentation decoupled from any single commercial vendor.
