Introduction
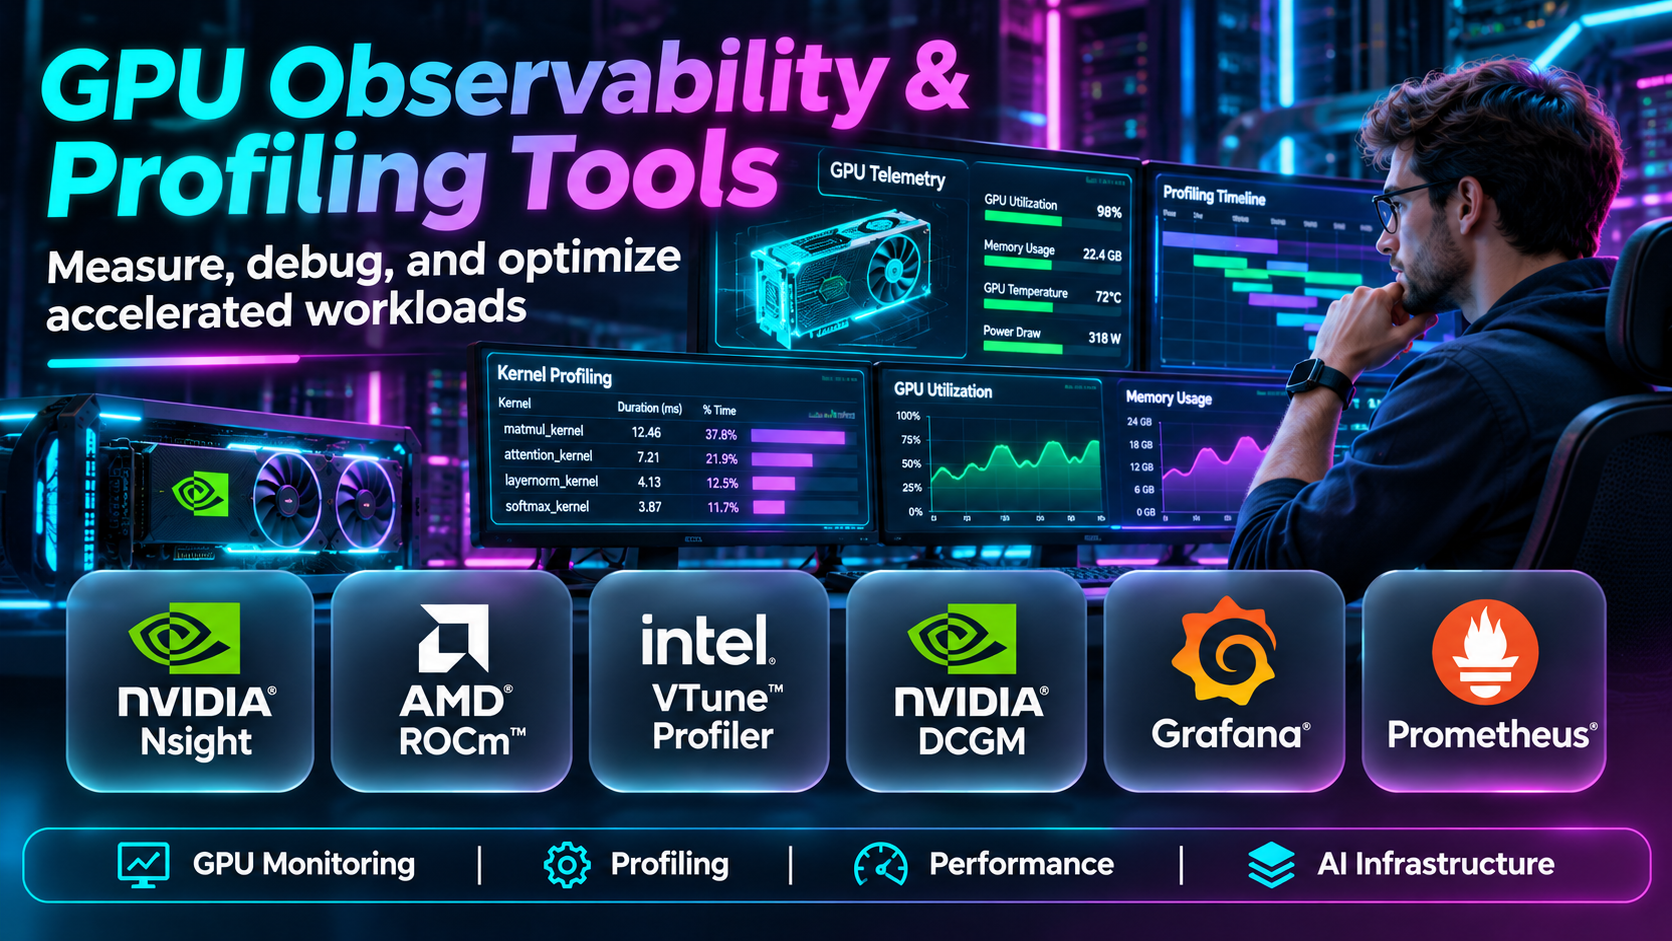
Graphics processing units have become essential for artificial intelligence, scientific computing, rendering, and other computationally intensive workloads.
However, GPU infrastructure is expensive, and inefficient workloads can waste processing capacity, memory, and energy.
GPU observability and profiling tools help engineering teams understand how applications use accelerator resources.
Some tools monitor infrastructure metrics across large GPU clusters. Others provide detailed kernel-level analysis to identify performance bottlenecks inside individual applications.
Understanding this distinction is critical. A monitoring dashboard may show high GPU utilization without explaining whether a CUDA kernel is operating efficiently.
This guide compares ten GPU observability and profiling tools and explains how to select the right solution for AI, machine learning, and high-performance computing environments.
What Are GPU Observability and Profiling Tools?
GPU observability tools collect and analyze information about accelerator usage, health, availability, and performance.
GPU profiling tools examine how applications execute on GPU hardware to identify inefficient operations.
Typical metrics include:
- GPU utilization
- GPU memory usage
- Memory bandwidth
- Kernel execution time
- GPU temperature
- Power consumption
- Compute occupancy
- CPU-to-GPU transfer time
- Accelerator errors
- Workload throughput
- Cluster capacity
- GPU allocation efficiency
Monitoring vs. Profiling
Monitoring answers questions such as:
- Which GPU is overloaded?
- How much memory is allocated?
- Are accelerators overheating?
- Which workloads are consuming capacity?
Profiling answers deeper questions:
- Which kernel consumes the most execution time?
- Are memory accesses efficient?
- Is execution limited by compute or memory bandwidth?
- Are CPU operations delaying GPU execution?
Many engineering teams need both capabilities.
Top 10 GPU Observability and Profiling Tools
1. NVIDIA Nsight Systems
Short Description
NVIDIA Nsight Systems is a system-wide performance analysis tool designed to help developers understand application execution across CPUs, GPUs, and related software components.
It is particularly valuable when GPU workloads experience delays that cannot be explained by utilization metrics alone.
The tool provides timeline-based analysis of application execution, helping developers examine CPU threads, GPU operations, CUDA activity, and synchronization behavior.
For example, an AI inference service may show low GPU utilization despite having available requests. Nsight Systems can help reveal whether CPU preprocessing, synchronization, or data transfer is limiting GPU activity.
Its system-level perspective makes it useful for understanding how application components interact.
However, Nsight Systems is primarily a profiling tool rather than a fleet-wide operational monitoring platform.
Key Features
- System execution timelines: Visualizes CPU and GPU activity over time.
- CUDA tracing: Shows supported CUDA operations and their execution relationships.
- CPU profiling: Helps identify host-side bottlenecks.
- GPU activity analysis: Examines accelerator execution patterns.
- Synchronization analysis: Reveals delays between application components.
- Data transfer visibility: Helps inspect CPU-GPU communication.
- Command-line profiling: Supports repeatable performance investigations.
- Trace visualization: Provides detailed graphical analysis of captured workloads.
Benefits
Nsight Systems helps developers identify application-level bottlenecks that would otherwise be hidden by basic GPU utilization metrics.
Pros
- Detailed execution timelines
- Strong CUDA ecosystem integration
- CPU and GPU visibility
- Useful for AI performance debugging
- Supports repeatable profiling
Cons
- Requires profiling expertise
- Trace files can be large
- Profiling adds some overhead
- Not designed for continuous cluster monitoring
Use Cases
AI inference optimization, CUDA application debugging, CPU-GPU synchronization analysis, and performance investigations.
Best For: Developers investigating system-level GPU application bottlenecks.
2. NVIDIA Nsight Compute
Short Description
NVIDIA Nsight Compute is a detailed GPU kernel profiler focused on understanding CUDA kernel performance.
Where Nsight Systems provides an application-wide execution view, Nsight Compute examines what happens inside individual GPU kernels.
Developers can analyze execution metrics related to memory throughput, instruction behavior, occupancy, and hardware utilization.
This is particularly useful when an application spends significant time in a specific kernel and developers need to understand why it is slow.
For example, a custom matrix operation may be limited by memory access patterns rather than arithmetic throughput. Nsight Compute can help investigate that distinction.
The tool is powerful but requires familiarity with GPU architecture and performance concepts.
Key Features
- CUDA kernel profiling
- GPU hardware performance metrics
- Memory throughput analysis
- Occupancy information
- Instruction-level performance indicators
- Source-level correlation where supported
- Kernel comparison workflows
- Detailed profiling reports
Benefits
Nsight Compute enables developers to move from identifying slow kernels to understanding their underlying performance limitations.
Pros
- Deep kernel analysis
- Hardware metric visibility
- Useful CUDA optimization workflows
- Detailed performance reports
- Strong NVIDIA ecosystem support
Cons
- Steep learning curve
- NVIDIA CUDA focus
- Profiling overhead
- Not an infrastructure monitoring system
Use Cases
CUDA kernel optimization, memory access analysis, GPU compute efficiency investigations, and custom operator development.
Best For: CUDA developers optimizing individual GPU kernels.
3. NVIDIA Data Center GPU Manager
Short Description
NVIDIA Data Center GPU Manager, commonly called DCGM, is a framework for monitoring and managing supported NVIDIA data center GPUs.
It focuses on operational metrics and device health rather than application-level source code profiling.
DCGM is particularly relevant to AI infrastructure teams operating multiple GPU servers or accelerator clusters.
Administrators can collect information about GPU utilization, memory, power, temperature, and supported health indicators.
DCGM also supports integrations with monitoring systems, making it useful for operational dashboards and alerts.
However, it does not replace detailed kernel profiling tools such as Nsight Compute.
Key Features
- GPU health monitoring
- Utilization metrics
- Memory usage reporting
- Temperature monitoring
- Power consumption metrics
- GPU diagnostics
- Telemetry integration
- Data center GPU management functions
Benefits
DCGM helps infrastructure teams maintain visibility into accelerator health and capacity across supported NVIDIA systems.
Pros
- Data center focus
- Operational GPU metrics
- Monitoring integrations
- Useful for cluster health
- Supports NVIDIA infrastructure workflows
Cons
- NVIDIA-specific
- Requires compatible hardware
- Limited application-level analysis
- Monitoring architecture must be configured
Use Cases
GPU fleet monitoring, AI cluster health checks, hardware diagnostics, and accelerator capacity reporting.
Best For: Infrastructure teams managing NVIDIA GPU clusters.
4. NVIDIA DCGM Exporter
Short Description
NVIDIA DCGM Exporter exposes GPU telemetry collected through DCGM in a format suitable for Prometheus-based monitoring.
It is particularly relevant to Kubernetes environments and other infrastructure platforms using Prometheus and Grafana.
The exporter allows operations teams to integrate GPU metrics into existing monitoring dashboards rather than maintain a separate monitoring interface.
For example, an AI platform team may combine GPU memory utilization, container resource metrics, and service performance data in Grafana.
This makes it easier to understand accelerator usage alongside broader infrastructure behavior.
However, DCGM Exporter is a telemetry collection component, not a complete observability product by itself.
Key Features
- Prometheus-compatible metrics
- DCGM telemetry integration
- GPU utilization reporting
- Memory metrics
- Temperature and power metrics
- Container monitoring support
- Kubernetes deployment compatibility
- Grafana dashboard integration
Benefits
DCGM Exporter connects GPU hardware telemetry with widely used cloud-native monitoring workflows.
Pros
- Prometheus integration
- Kubernetes relevance
- Open monitoring ecosystem
- Useful GPU dashboards
- Supports infrastructure correlation
Cons
- Requires monitoring infrastructure
- NVIDIA-specific
- Limited application profiling
- Metric configuration requires care
Use Cases
Kubernetes GPU monitoring, Prometheus telemetry pipelines, Grafana dashboards, and AI infrastructure observability.
Best For: Platform engineers using Prometheus and Grafana to monitor NVIDIA GPUs.
5. AMD ROCm Profiler
Short Description
AMD’s ROCm profiling ecosystem provides tools for examining performance on supported AMD GPU workloads.
These tools help developers investigate GPU execution, application traces, and performance metrics within the ROCm software environment.
They are particularly relevant to organizations developing AI and high-performance computing applications on AMD accelerators.
A profiling workflow may involve capturing execution traces, identifying expensive operations, and analyzing memory or compute behavior.
The ROCm profiling toolchain has evolved over time, so users should select the currently supported components for their ROCm release and GPU architecture.
This is important because command-line interfaces, profiler names, and supported features can differ between versions.
Key Features
- AMD GPU profiling
- Kernel performance analysis
- Execution tracing
- Hardware performance counters
- Memory behavior analysis
- ROCm integration
- Command-line workflows
- Performance report generation
Benefits
ROCm profiling tools help developers optimize GPU workloads without depending on NVIDIA-specific profiling software.
Pros
- AMD accelerator support
- Detailed performance analysis
- ROCm ecosystem integration
- Useful for HPC and AI
- Supports technical optimization workflows
Cons
- Hardware compatibility requirements
- Version-dependent tooling
- Technical learning curve
- Not a complete fleet monitoring service
Use Cases
AMD GPU optimization, ROCm application development, HPC performance analysis, and AI kernel profiling.
Best For: Developers building applications for AMD GPU infrastructure.
6. Intel VTune Profiler
Short Description
Intel VTune Profiler is a performance analysis tool used to investigate application execution and hardware resource utilization.
It is relevant to developers working with Intel processors and supported accelerator environments.
VTune can help identify CPU bottlenecks, threading problems, memory inefficiencies, and selected heterogeneous computing performance issues.
This is valuable because GPU application performance is often affected by CPU-side operations.
For example, a data processing pipeline may fail to keep an accelerator busy because host-side preprocessing is too slow.
VTune’s suitability for a particular GPU depends on supported hardware, drivers, software stacks, and profiling capabilities.
Key Features
- CPU performance profiling
- Threading analysis
- Memory bottleneck investigation
- Hardware performance metrics
- Heterogeneous workload analysis
- Timeline views
- Source-level correlation
- Performance reporting
Benefits
VTune helps developers identify performance bottlenecks across supported compute components, including CPU-side issues affecting accelerator workloads.
Pros
- Detailed performance analysis
- Strong CPU profiling
- Useful heterogeneous computing context
- Hardware metrics
- Developer-oriented reports
Cons
- GPU support is hardware-dependent
- Learning curve
- Not a general GPU fleet monitor
- Platform compatibility requires review
Use Cases
CPU-GPU pipeline analysis, Intel compute optimization, memory bottleneck investigations, and HPC application profiling.
Best For: Developers optimizing Intel-oriented and heterogeneous computing workloads.
7. PyTorch Profiler
Short Description
PyTorch Profiler is a performance analysis capability integrated into the PyTorch machine learning framework.
It helps developers understand how model operations consume CPU and GPU execution time.
The profiler is particularly useful for identifying expensive tensor operations, inefficient training steps, and bottlenecks in deep learning workloads.
Developers can collect profiling information during selected training or inference steps and analyze the resulting traces.
A practical workflow might compare the time spent on data loading, forward passes, backward passes, and optimizer operations.
However, profiling should be performed carefully because extensive trace collection can affect application performance.
Key Features
- CPU operation profiling
- GPU operation timing
- PyTorch operator analysis
- Execution trace generation
- Memory profiling options
- Training step investigation
- Profiling schedules
- Performance visualization integrations
Benefits
PyTorch Profiler helps machine learning engineers understand model-level performance without beginning with low-level GPU kernel analysis.
Pros
- Integrated with PyTorch
- Relevant to training and inference
- Operator-level visibility
- Useful trace outputs
- Supports model optimization
Cons
- PyTorch-specific
- Profiling overhead
- Large trace outputs
- Limited infrastructure monitoring
Use Cases
Deep learning training optimization, inference profiling, operator analysis, and data pipeline investigations.
Best For: Machine learning engineers developing PyTorch models.
8. TensorBoard Profiler
Short Description
TensorBoard Profiler provides performance analysis capabilities for supported TensorFlow workloads.
It helps machine learning engineers investigate training execution, operation timing, and resource utilization.
The profiler can be useful when TensorFlow training jobs are slower than expected or accelerator resources appear underutilized.
Its visual reports can help identify performance problems such as input pipeline bottlenecks or inefficient execution.
TensorBoard’s broader visualization environment can also provide useful context around model development.
However, profiler functionality depends on the TensorFlow version, hardware environment, and supported integrations.
Key Features
- TensorFlow performance profiling
- Training execution timelines
- Input pipeline analysis
- GPU utilization insights
- Operation-level performance views
- Trace visualization
- Model development integration
- Performance investigation reports
Benefits
TensorBoard Profiler helps TensorFlow users connect model training behavior with performance bottlenecks.
Pros
- TensorFlow integration
- Visual profiling reports
- Useful training analysis
- Input pipeline visibility
- Familiar ML development environment
Cons
- Framework-specific
- Version compatibility matters
- Profiling overhead
- Not a fleet-wide GPU monitoring solution
Use Cases
TensorFlow training optimization, input pipeline debugging, model performance analysis, and accelerator utilization investigation.
Best For: TensorFlow engineers investigating model execution performance.
9. Datadog GPU Monitoring
Short Description
Datadog provides infrastructure observability capabilities that can include GPU metrics through supported integrations and monitoring configurations.
It is relevant to organizations that want GPU telemetry alongside application, container, and infrastructure monitoring.
A key advantage is correlation. Operations teams can investigate GPU utilization in the context of service latency, infrastructure events, and workload behavior.
For example, an inference service experiencing slower response times may be examined alongside GPU memory pressure and host-level metrics.
Datadog’s broader observability ecosystem can help teams create dashboards, alerts, and operational workflows.
However, deep CUDA kernel analysis still requires specialized profiling tools.
Key Features
- GPU metric ingestion
- Infrastructure dashboards
- Alerting
- Container monitoring
- Application performance correlation
- Historical metrics
- Integration ecosystem
- Operational reporting
Benefits
Datadog can connect GPU infrastructure monitoring with broader application observability.
Pros
- Unified observability environment
- Flexible dashboards
- Alerting capabilities
- Infrastructure correlation
- Useful for production operations
Cons
- Usage-based costs can increase
- Integration setup required
- GPU coverage varies
- Not a kernel profiler
Use Cases
Production AI monitoring, GPU infrastructure dashboards, inference service troubleshooting, and operational alerting.
Best For: Organizations already using Datadog for infrastructure and application observability.
10. Grafana
Short Description
Grafana is an observability visualization platform that can display GPU telemetry collected from compatible data sources.
It is commonly used with Prometheus and NVIDIA DCGM Exporter to create dashboards for accelerator infrastructure.
Grafana does not collect all GPU metrics by itself. Instead, it visualizes data provided by monitoring integrations.
This separation allows engineering teams to build flexible dashboards that combine GPU, CPU, memory, network, and application metrics.
For example, a Kubernetes platform team can compare GPU utilization with workload scheduling and application throughput.
However, the team must design appropriate telemetry pipelines, alerts, retention policies, and dashboards.
Key Features
- Customizable dashboards
- Multiple data sources
- Prometheus integration
- Alerting capabilities
- Historical visualization
- Metric correlation
- Team dashboards
- Observability ecosystem integrations
Benefits
Grafana gives teams flexible ways to visualize GPU telemetry alongside broader infrastructure and application metrics.
Pros
- Flexible dashboards
- Broad integrations
- Cloud-native relevance
- Useful alerting
- Custom visualization
Cons
- Requires data collection systems
- Dashboard maintenance
- No native kernel profiling
- Operational setup can be complex
Use Cases
GPU cluster dashboards, Kubernetes monitoring, capacity planning, accelerator health reporting, and AI infrastructure operations.
Best For: Platform teams building customizable GPU observability dashboards.
GPU Observability and Profiling Comparison Table
| Tool | Primary Focus | Best For | Main Limitation |
|---|---|---|---|
| Nsight Systems | System-level profiling | CUDA developers | Not fleet monitoring |
| Nsight Compute | Kernel profiling | GPU optimization | Technical complexity |
| NVIDIA DCGM | GPU health and telemetry | Data centers | NVIDIA focus |
| DCGM Exporter | Prometheus metrics | Kubernetes teams | Requires monitoring stack |
| ROCm Profiler | AMD GPU profiling | AMD developers | Version compatibility |
| Intel VTune | Performance analysis | Heterogeneous workloads | Hardware-dependent coverage |
| PyTorch Profiler | Model operation profiling | PyTorch engineers | Framework-specific |
| TensorBoard Profiler | TensorFlow profiling | TensorFlow engineers | Framework-specific |
| Datadog | Production monitoring | Operations teams | Cost and integration |
| Grafana | Telemetry visualization | Platform engineers | Needs external data sources |
How to Choose GPU Observability and Profiling Tools
Identify the Performance Question
Choose profiling when the goal is to understand slow application operations.
Choose observability when the goal is to monitor infrastructure health and capacity over time.
Match the Hardware Platform
NVIDIA, AMD, and Intel environments have different profiling ecosystems.
Consider the Software Framework
PyTorch and TensorFlow users may begin with framework-level profiling before investigating low-level kernels.
Evaluate Cluster Requirements
Large GPU environments benefit from centralized metrics, alerts, and historical reporting.
Measure Profiling Overhead
Detailed profiling can change application behavior and should be performed under controlled conditions.
Best GPU Tools by User Type
| User Type | Recommended Tools | Reason |
|---|---|---|
| CUDA developer | Nsight Systems, Nsight Compute | Detailed execution analysis |
| NVIDIA infrastructure engineer | DCGM, DCGM Exporter | Hardware telemetry |
| AMD GPU developer | ROCm profiling tools | AMD-specific analysis |
| PyTorch engineer | PyTorch Profiler | Model operation visibility |
| TensorFlow engineer | TensorBoard Profiler | Training analysis |
| Production operations team | Datadog | Unified monitoring |
| Kubernetes platform team | Grafana, DCGM Exporter | Custom GPU dashboards |
| Intel performance engineer | VTune | Supported hardware analysis |
Practical Example: Investigating Slow AI Inference
Consider an AI service running on NVIDIA GPUs.
The service experiences increasing response times despite having available GPU capacity.
Step 1: Review Infrastructure Metrics
The operations team checks utilization, memory, temperature, and power metrics.
Step 2: Correlate Application Latency
The team compares request latency with GPU activity.
Step 3: Capture an Execution Trace
Nsight Systems is used to examine CPU and GPU execution timelines.
Step 4: Identify Delays
The trace reveals whether preprocessing, data transfers, or synchronization contribute to latency.
Step 5: Profile Expensive Kernels
Nsight Compute is used to investigate individual CUDA kernels where necessary.
Step 6: Optimize and Retest
Developers make targeted changes and compare results under similar workloads.
Step 7: Monitor Production
The team creates dashboards and alerts to detect future regressions.
Common GPU Monitoring Challenges
High Utilization Does Not Guarantee Efficiency
A GPU can be busy while executing inefficient operations.
Metric Collection Overhead
Detailed profiling can consume resources and alter timing.
Hardware Differences
Metrics and profiler support vary across GPU architectures.
Multi-Tenant Environments
Shared accelerator infrastructure can complicate workload attribution.
Incomplete Visibility
Hardware metrics alone may not explain application performance.
Frequently Asked Questions
1. What is GPU observability?
It is the collection and analysis of GPU health, usage, and performance information.
2. What is GPU profiling?
It is detailed analysis of how applications execute on GPUs.
3. What is the difference between monitoring and profiling?
Monitoring tracks operational behavior; profiling investigates performance bottlenecks.
4. What is GPU utilization?
It is a measure of GPU activity over a defined interval.
5. Does high utilization mean optimal performance?
No.
6. What is GPU memory profiling?
It examines how applications allocate and use accelerator memory.
7. What is CUDA profiling?
It analyzes applications using NVIDIA’s CUDA programming environment.
8. Can PyTorch Profiler analyze GPU workloads?
Yes, in supported configurations.
9. Can Grafana monitor GPUs?
Yes, when connected to appropriate telemetry sources.
10. What is DCGM?
It is NVIDIA’s Data Center GPU Manager framework.
11. What is DCGM Exporter?
It exposes supported DCGM metrics for Prometheus monitoring.
12. Can Datadog monitor GPU infrastructure?
Yes, through supported monitoring capabilities and integrations.
13. Do AMD GPUs require different profiling tools?
AMD GPU workloads commonly use ROCm-compatible profiling tools.
14. Does profiling affect performance?
It can introduce overhead.
15. Why is GPU memory bandwidth important?
Memory transfer limits can restrict computational performance.
16. Which GPU profiling tool is best?
The best tool depends on hardware, framework, workload, and the performance question.
Final Thoughts
GPU observability and profiling are complementary disciplines.
Nsight Systems and Nsight Compute provide detailed NVIDIA application profiling.
DCGM and DCGM Exporter support operational monitoring of NVIDIA GPU infrastructure.
ROCm profiling tools serve supported AMD environments, while Intel VTune supports selected heterogeneous performance investigations.
PyTorch Profiler and TensorBoard Profiler help machine learning developers understand framework-level execution.
Datadog and Grafana provide broader operational visibility.
The most effective strategy combines infrastructure monitoring with targeted application profiling, allowing teams to identify bottlenecks and verify improvements with reliable measurements.
