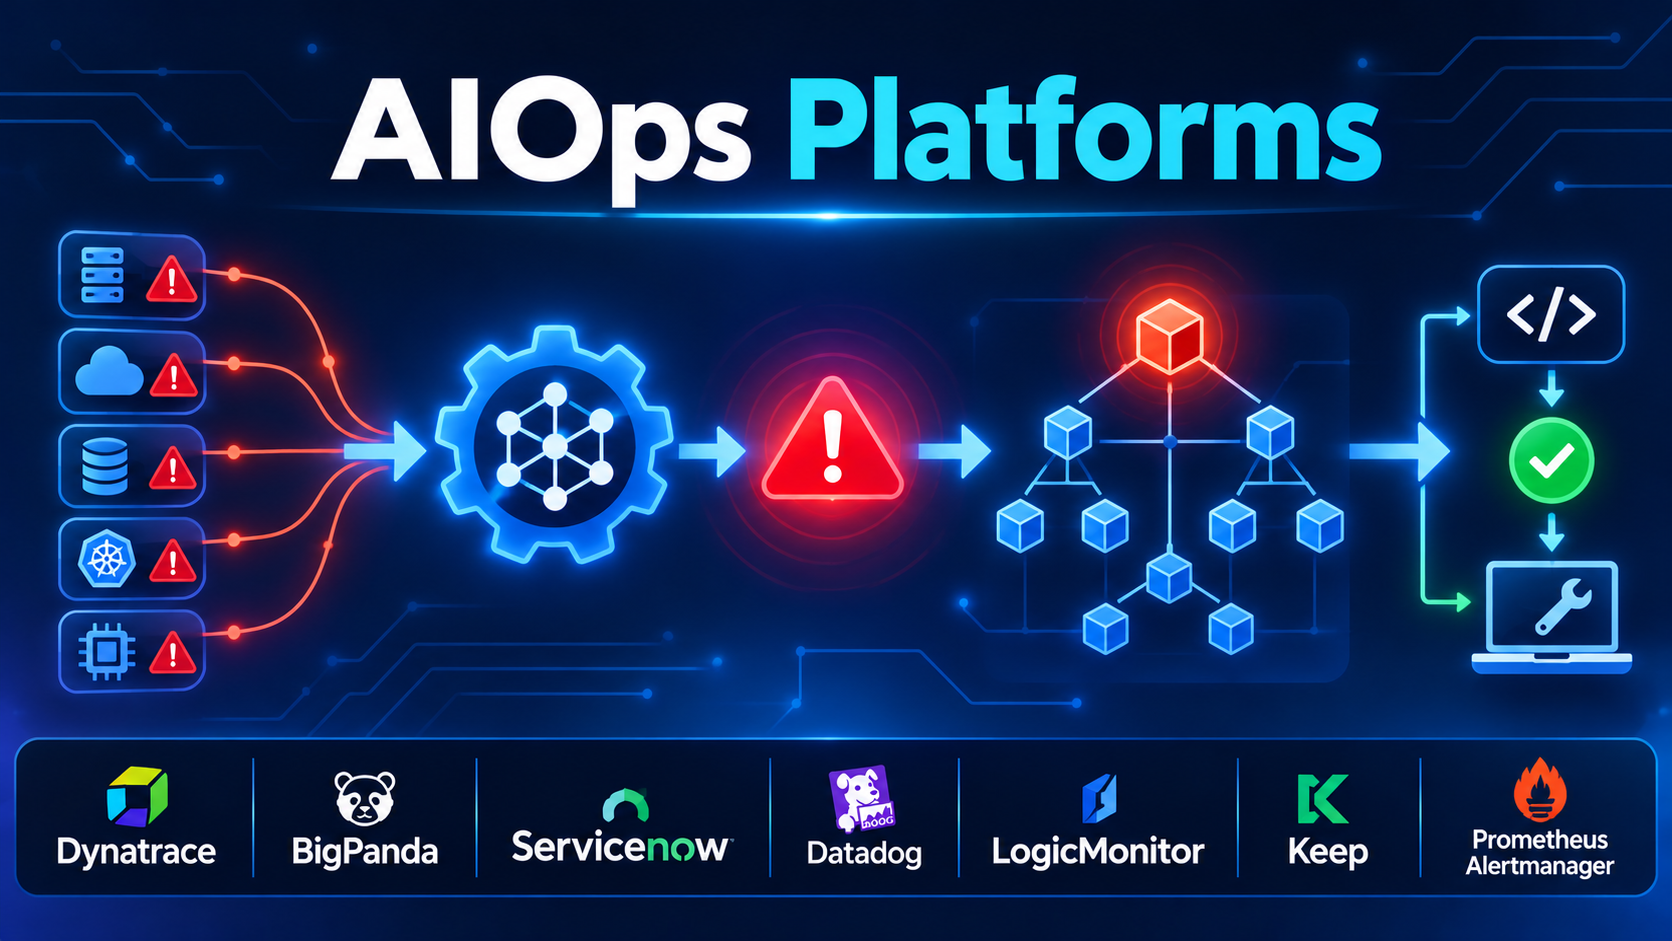
When a core database switch flaps or an upstream cloud availability zone degrades, modern enterprise monitoring stacks do not fail silently—they flood Slack channels and incident queues with thousands of derivative alerts across microservices, load balancers, storage arrays, and synthetic checks. On-call engineers spend the first thirty minutes of a severe outage simply filtering out symptoms to locate the single failing component.
AIOps (Artificial Intelligence for IT Operations) platforms exist to compress that alert noise into actionable incident diagnoses and trigger automated remediation. Yet the AIOps market is heavily clouded by vague AI marketing claims. Beneath the buzzwords, platforms rely on fundamentally different technical mechanisms: pure-play event correlation layers that sit atop existing monitoring tools, full-stack observability platforms with deterministic topology engines, and open-source alert-enrichment pipelines. Selecting the right platform requires distinguishing proven algorithmic noise reduction and causal topology mapping from black-box anomaly alerts that merely create a new stream of false positives.
Three Distinct Architectures in AIOps Software
Before comparing specific vendors, enterprise operations and SRE teams should separate the three architectural models that define how AIOps platforms ingest telemetry and isolate root causes.
1. Domain-Agnostic Event Correlation and Noise Reduction Layers
Platforms such as BigPanda, Moogsoft (Dell), and PagerDuty Event Intelligence do not replace your existing monitoring agents. Instead, they ingest raw alert streams from Datadog, Prometheus, SolarWinds, New Relic, Zabbix, and cloud consoles—using temporal clustering, text similarity, and CMDB enrichment to group hundreds of related alerts into a single incident ticket.
- Core strength: Works across heterogeneous, legacy-plus-cloud enterprise environments where ripping and replacing ten separate monitoring tools is impossible.
- Primary trade-off: Correlation quality depends heavily on clean alert metadata and CMDB topology accuracy; without structured tags, grouping rules require ongoing tuning.
2. Full-Stack Observability with Causal Topology Engines
Platforms like Dynatrace (Davis AI), IBM Instana, and Datadog Watchdog collect high-resolution traces, metrics, logs, and process dependencies directly via their own instrumentation, building real-time dependency graphs that trace cascading failures back to their origin.
- Core strength: Deterministic root-cause isolation backed by live service-to-infrastructure dependency maps rather than purely statistical alert clustering.
- Primary trade-off: Delivers maximum value only when the platform instruments the majority of your stack; blind spots in unmonitored legacy tiers weaken causal tracing.
3. Open-Source Alert Enrichment and Machine-Learning Anomaly Pipelines
Modular open-source tools—such as Keep (open-source AIOps and alert management) and Robusta (Kubernetes alert enrichment and remediation)—pair with Prometheus Alertmanager and OpenTelemetry to deduplicate alerts, enrich webhooks with live cluster diagnostics, and trigger automated runbooks without enterprise SaaS lock-in.
- Core strength: Transparent rule logic, GitOps-friendly configuration, and zero per-node commercial licensing.
- Primary trade-off: Requires platform engineering ownership to maintain integrations and lacks broad legacy mainframe or enterprise CMDB discovery out of the box.
Notable AIOps Platforms Across Enterprise and Cloud-Native Workflows
Dynatrace (Davis AI) — Deterministic Causal Root-Cause Analysis
Dynatrace differentiates itself from probabilistic machine-learning alert tools by combining three analytical techniques inside its Davis AI engine: deterministic topological causation (via its real-time Smartscape dependency map), statistical anomaly baselining, and generative AI assistance for summarizing incident context and remediation steps.
Because Dynatrace’s OneAgent automatically maps every process, container, microservice, and host dependency, Davis AI does not guess which alerts are related—it walks the live dependency graph to identify the exact upstream bottleneck causing downstream timeouts. It is particularly strong for large hybrid enterprises running complex Kubernetes and legacy middleware estates, though its commercial pricing and agent-centric footprint require meaningful budget commitment.
BigPanda — Open Box Event Correlation for Heterogeneous Monitoring Estates
Built specifically as an independent AIOps event-correlation and automation layer, BigPanda ingests alerts, change events (from Git, Jenkins, ServiceNow, and Terraform), and topology data across fragmented enterprise monitoring tools.
BigPanda’s standout design choice is Open Box Machine Learning: rather than hiding alert-grouping logic inside an opaque neural network, it exposes human-readable correlation patterns that operations engineers can inspect, adjust, and version-control. By correlating incoming alerts directly with recent deployment and configuration changes, BigPanda helps IT operations centers (NOCs) and SRE teams identify bad releases rapidly. Its focus is event intelligence and ITSM synchronization (such as ServiceNow) rather than acting as a low-level APM or code-profiling agent.
ServiceNow ITOM (AIOps & Health Log Analytics) — Enterprise ITSM and CMDB Convergence
For global enterprises already standardized on ServiceNow for IT Service Management, ServiceNow IT Operations Management (ITOM) embeds event management, metric anomaly detection, and log-based anomaly analysis directly on top of the enterprise Configuration Management Database (CMDB).
When monitoring alerts fire, ServiceNow maps affected infrastructure items directly to business service maps, opens incident records, predicts probable root causes based on historical change tickets, and triggers automated remediation workflows. Its strength lies in enterprise governance and business-impact visibility, though its value depends heavily on maintaining an accurate, up-to-date CMDB.
Datadog Watchdog — Embedded Anomaly Detection Across Full-Stack Telemetry
Rather than selling a separate standalone AIOps console, Datadog embeds Watchdog directly across its APM, infrastructure, log management, and RUM datasets. Watchdog continuously baselines seasonal traffic patterns, latency distributions, error rates, and container memory growth without requiring manual threshold configuration—surfacing proactive alerts when a specific deployment version, availability zone, or SQL query deviates from historical norms.
For teams already consolidated on Datadog, Watchdog provides immediate, zero-configuration anomaly detection and automated fault-tree insights. Organizations running split monitoring across multiple third-party vendors, however, will find its cross-tool correlation narrower than dedicated event-aggregation layers like BigPanda.
LogicMonitor (Edwin AI) — Hybrid Infrastructure and Network AIOps
LogicMonitor focuses heavily on hybrid cloud, data center, network hardware, and storage infrastructure monitoring, pairing broad SNMP/API collector coverage with Edwin AI for alert correlation, root-cause summarization, and ITSM ticket enrichment.
It is particularly well suited for managed service providers (MSPs) and enterprise IT infrastructure teams overseeing networks, servers, and cloud resources alongside application tiers.
Keep — Open-Source Alert Management and AIOps Workflow Engine
Keep has gained traction among cloud-native engineering teams as an open-source, self-hostable AIOps and alert-consolidation control plane. Connecting bi-directionally to Prometheus, Datadog, Sentry, PagerDuty, Jira, and Slack, Keep deduplicates alerts, correlates related signals using declarative YAML workflows, enriches incidents with LLM-assisted summaries (supporting self-hosted or commercial model endpoints), and triggers automated remediation scripts.
Keep offers transparent, developer-friendly alert governance without heavy enterprise licensing, though large organizations needing automated network discovery across legacy data centers will still require enterprise ITOM platforms.
Comparison of AIOps Platforms
| Platform | Primary Architectural Role | Data & Telemetry Sources | Deployment Model | Standout Strength | Primary Trade-Off |
| Dynatrace (Davis AI) | Full-stack observability + causal AIOps | OneAgent telemetry, OpenTelemetry, cloud APIs | Managed SaaS or Self-Hosted | Deterministic dependency-graph root-cause isolation without manual rules | Commercial enterprise pricing and strong agent-based coupling |
| BigPanda | Domain-agnostic event correlation layer | Alerts, change feeds, & CMDB from any tool | Managed Cloud SaaS | Transparent “Open Box” alert clustering and change-to-incident correlation | Requires separate underlying monitoring/APM tools to collect raw telemetry |
| ServiceNow ITOM | Enterprise ITSM-integrated AIOps | Enterprise monitoring tools + ServiceNow CMDB | Enterprise Cloud SaaS | Direct mapping between infrastructure alerts, CMDB business services, and change tickets | Effectiveness depends heavily on CMDB hygiene and ServiceNow administration |
| Datadog Watchdog | Embedded observability anomaly engine | Datadog APM, logs, metrics, & RUM | Managed Cloud SaaS | Zero-configuration seasonal baselining and deployment-regression detection | Scoped primarily to telemetry ingested inside Datadog |
| LogicMonitor (Edwin AI) | Hybrid infrastructure & network AIOps | Cloud, network gear, servers, & logs | Managed Cloud SaaS | Strong hybrid data-center/network visibility paired with alert noise reduction | Less focused on deep developer code-level profiling |
| Keep | Open-source alert correlation & automation | Prometheus, Datadog, Sentry, webhooks | Open-Source Self-Hosted or Cloud | Declarative YAML correlation workflows and zero-license self-hosted control | Narrower legacy enterprise discovery than commercial ITOM suites |
Four Evaluation Checks to Separate Real AIOps from Marketing Noise
1. Explainability (“Open Box” vs. “Black Box” Grouping)
If an AIOps platform merges forty alerts into a single incident or suppresses a critical page without explaining why, on-call engineers will quickly lose trust and bypass the tool. Verify whether the platform shows the exact topological link, shared tag, or temporal pattern behind every grouped incident—and allows operators to override or tune grouping rules cleanly.
2. Change-Event Correlation Alongside Alert Data
Industry postmortem data consistently shows that a large share of production incidents follow recent code deployments, feature-flag toggles, or infrastructure configuration changes. Prioritize platforms that ingest change streams (GitHub/GitLab deployments, Argo CD syncs, Terraform runs, ServiceNow change requests) alongside monitoring alerts so the system surfaces suspect changes immediately.
3. Cold-Start Baseline Requirements
Statistical anomaly models often require two to four weeks of historical traffic before recognizing weekly or seasonal patterns—during which time they either flood teams with false positives or stay blind to slow degradations. Ask vendors how their models handle newly launched microservices, ephemeral Kubernetes pods, and planned marketing traffic spikes.
4. Metadata and Tag Hygiene Prerequisites
Machine-learning correlation cannot infer relationships out of thin air if half your monitoring alerts lack consistent service, environment, cluster, and owner tags. Before buying an enterprise AIOps layer, audit your monitoring alert payloads—often, standardizing alert tags and routing rules solves 50% of alert noise before any AI model runs.
Choosing the Right AIOps Strategy
- For large enterprises struggling with alert storms across dozens of disconnected monitoring and ITSM tools: BigPanda (for agile, transparent event and change correlation) or ServiceNow ITOM (when workflows are anchored in a mature ServiceNow CMDB) delivers the strongest cross-tool consolidation.
- For organizations seeking unified full-stack observability with automated, topology-driven root-cause analysis: Dynatrace provides unmatched deterministic causation across complex hybrid and Kubernetes workloads.
- For cloud-native teams already standardized on Datadog: Enable Datadog Watchdog and deployment-tracking monitors first before investing in an external AIOps overlay.
- For DevOps and SRE teams wanting open-source, code-driven alert deduplication and workflow automation: Pilot Keep alongside Prometheus Alertmanager and OpenTelemetry pipelines.
