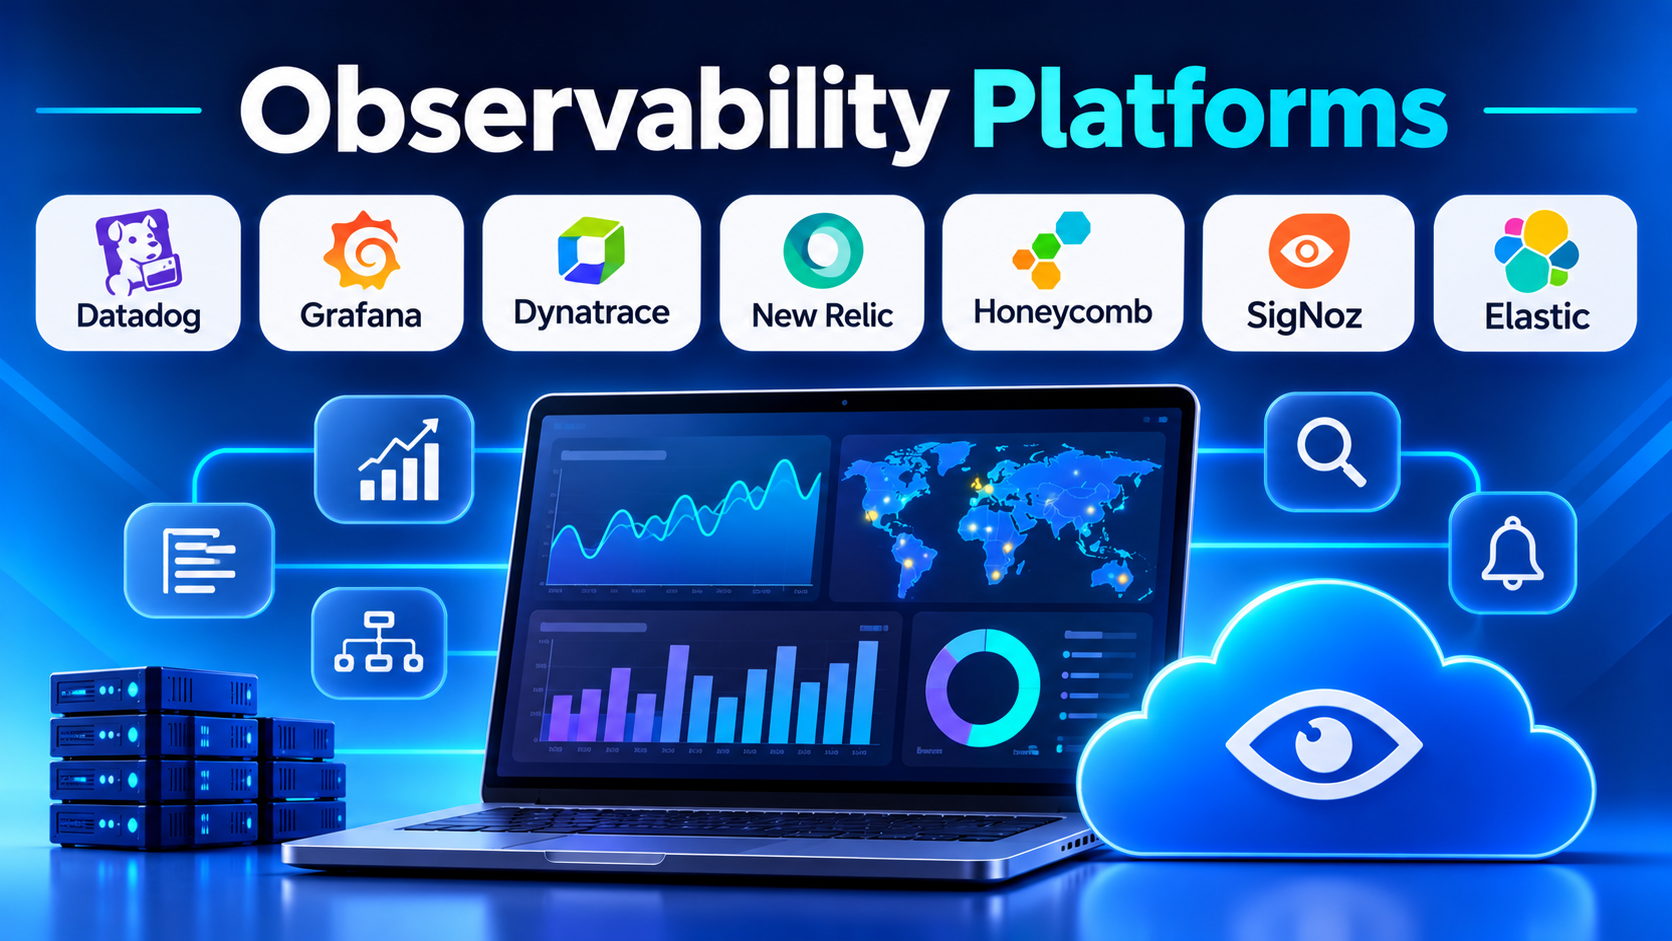
When an API gateway starts returning intermittent 504 timeouts at 2:00 AM, having three separate dashboards—one for Kubernetes CPU metrics, another for centralized JSON logs, and a third for distributed traces—rarely speeds up root-cause analysis. Engineers still waste critical minutes copying request IDs across browser tabs while trying to figure out whether a downstream database lock, a noisy neighbor pod, or a specific customer tenant triggered the degradation.
Observability platforms promise to unify metrics, logs, traces, and continuous profiling into a single correlated context. Yet evaluating these platforms requires looking past glossy service-map demos. The real differentiators lie in how each platform prices telemetry ingestion, how cleanly it handles high-cardinality dimensions (such as individual user IDs or container hashes) without exploding storage bills, and whether it locks your instrumentation into proprietary agents or embraces OpenTelemetry standards.
Three Architectural Models in Modern Observability
Before comparing specific vendors or open-source stacks, platform and site reliability engineering (SRE) teams should separate three distinct approaches to telemetry collection and storage.
1. All-in-One Commercial SaaS Platforms
Vendors such as Datadog, New Relic, and Dynatrace provide turnkey ingestion, storage, dashboards, alerting, APM, real-user monitoring (RUM), and incident response inside a single multi-tenant cloud platform.
- Core strength: Minimal setup time, deep out-of-the-box integrations across hundreds of cloud services, and seamless pivoting between a slow trace span, its host metrics, and surrounding log lines.
- Primary trade-off: Complex, multi-dimensional pricing (combining per-host fees, indexed log volume, custom metric cardinality, and APM seat charges) that can become unpredictable as traffic scales.
2. Composable Open-Source Observability Stacks (The LGTM Model)
The Grafana ecosystem—combining Loki (logs), Grafana (visualization), Tempo (distributed traces), and Mimir or Prometheus (metrics)—allows teams to assemble a modular, OpenTelemetry-native observability backend either self-hosted on Kubernetes or consumed via Grafana Cloud.
- Core strength: Eliminates proprietary vendor lock-in and dramatically reduces storage costs by indexing metadata labels rather than full-text log payloads or trace tags, storing raw blocks in inexpensive object storage (such as Amazon S3 or GCS).
- Primary trade-off: Self-hosting requires dedicated platform engineering capacity to tune compaction, object-store retention, and query-frontend scaling at high ingestion volumes.
3. Wide-Event and High-Cardinality Analytics Engines
Platforms such as Honeycomb and ClickHouse-backed observability backends (like SigNoz or HyperDX) reject the rigid separation of metrics, logs, and traces in favor of structured, high-cardinality “wide events.”
- Core strength: Enables arbitrary, sub-second slicing and dicing across millions of unique dimensions (specific customer IDs, feature flags, build SHAs, or shopping cart sizes) without pre-aggregating metrics or paying punitive custom-metric surcharges.
- Primary trade-off: Requires engineering teams to instrument structured events deliberately rather than relying solely on passive, unstructured stdout log scraping.
Notable Observability Platforms Across Workflows
Datadog — Broadest Turnkey Integration Ecosystem
Datadog is the most widely adopted commercial SaaS observability suite for cloud-native organizations seeking unified visibility across infrastructure, APM, log management, security monitoring, and synthetic testing. With hundreds of vendor-maintained integrations, teams can ingest telemetry from AWS, Kubernetes, databases, and CI/CD pipelines rapidly.
Datadog excels when engineering organizations want immediate cross-signal correlation—jumping from a spike in endpoint latency directly to flame graphs, container metrics, and related logs—without operating storage infrastructure. Its primary drawback is cost governance: separate billing meters for APM hosts, custom metrics, log ingestion, log indexing, and profiling require disciplined sampling and quota controls to prevent unexpected overages.
Grafana Cloud and the Open-Source LGTM Stack — Open-Standards Modularity
Grafana has evolved from a dashboard visualization layer into a complete observability platform anchored by open-source storage engines: Prometheus/Mimir for metrics, Loki for label-indexed logs, Tempo for object-storage-backed tracing, and Pyroscope for continuous profiling.
Organizations can run these components independently on their own Kubernetes clusters or adopt Grafana Cloud to offload cluster operations while retaining full compatibility with OpenTelemetry collectors and PromQL/LogQL query languages. Because Loki and Tempo avoid heavy full-text indexing in favor of object storage, the stack scales cost-effectively for high-volume telemetry, though ad-hoc full-text regex searches across unindexed historical logs run slower than in traditional search-engine-backed log stores.
Dynatrace — Automated Discovery and Deterministic Root-Cause Analysis
Dynatrace targets large enterprise environments—spanning Kubernetes, hybrid cloud, and legacy virtual machines—with an emphasis on automated instrumentation and topology mapping. Its OneAgent technology automatically discovers running processes, injects bytecode instrumentation across supported runtimes, and maps service dependencies dynamically without manual code changes.
Its Davis AI engine uses deterministic topology graphs rather than purely probabilistic guesswork to pinpoint the root cause of cascading outages across complex enterprise architectures. Dynatrace is particularly strong for large enterprises with limited developer capacity to manually instrument OpenTelemetry SDKs across legacy applications, though its commercial pricing and agent-centric architecture carry higher vendor coupling than open-source alternatives.
New Relic — Consumption-Based Full-Stack Telemetry
New Relic consolidated its previously fragmented product pricing into a unified consumption model centered on data ingest (per gigabyte) and user seats, offering full-stack APM, infrastructure monitoring, browser/mobile RUM, log management, and OpenTelemetry support inside a single platform.
Its NRQL (New Relic Query Language) allows engineers to query metrics, events, logs, and traces using SQL-like syntax across unified telemetry tables. For organizations whose primary cost bottleneck in competing SaaS tools was high host counts or custom metric cardinality, New Relic’s data-ingest pricing model can be substantially more predictable—provided teams filter noisy debug logs before ingestion.
Honeycomb — High-Cardinality Debugging for Distributed Systems
Built specifically for debugging complex, unpredictable microservice architectures, Honeycomb centers its workflow around structured wide events and its BubbleUp anomaly-detection engine. When latency spikes on an API endpoint, BubbleUp automatically compares anomalous requests against baseline traffic across every attached attribute—surfacing immediately if 98% of slow requests share a single customer_id, availability_zone, or deploy_version.
Honeycomb is a natural fit for teams adopting OpenTelemetry tracing who want fast exploratory debugging rather than static threshold dashboards. Teams heavily reliant on traditional host-level SNMP monitoring or legacy on-premises infrastructure will find its focus narrower than broad infrastructure suites like Datadog or Dynatrace.
SigNoz — Open-Source, OpenTelemetry-Native ClickHouse Alternative
For teams seeking an open-source, self-hostable alternative to Datadog or New Relic without assembling separate metric, log, and trace databases, SigNoz builds unified APM, logs, metrics, and distributed tracing on top of ClickHouse—a high-performance columnar analytical database.
Because SigNoz natively ingests OpenTelemetry (OTLP) data and stores all signals inside ClickHouse, it handles high-cardinality trace and log attributes efficiently while offering a single unified UI. Organizations can self-host the open-source edition via Docker or Kubernetes or use SigNoz Cloud for managed hosting.
Elastic Observability — Search-Driven Log Analytics and APM
Built on Elasticsearch and Kibana, Elastic Observability remains a top contender for organizations whose troubleshooting workflows revolve around massive-scale log analytics, full-text search, and unified SIEM security operations.
Teams already operating Elasticsearch clusters for search or security analytics can extend their existing infrastructure to ingest OpenTelemetry traces, host metrics, and eBPF continuous profiling. However, operating high-volume Elasticsearch clusters requires careful shard management, index lifecycle policies, and SSD storage planning to keep infrastructure costs contained.
Comparison of Observability Platforms
| Platform / Stack | Primary Architecture | Hosting & Deployment | OpenTelemetry Support | Standout Strength | Primary Trade-Off |
| Datadog | Unified commercial SaaS | Managed Cloud SaaS | Native OTLP ingestion + proprietary agent | Broadest turnkey integration catalog and fast cross-signal UI pivoting | Multi-dimensional billing (hosts, custom metrics, indexed logs) requires tight governance |
| Grafana / LGTM Stack | Modular open-source engines (Mimir, Loki, Tempo) | Self-Hosted (OSS) or Grafana Cloud | First-class native OTel & Prometheus | Cost-efficient object-storage backend and zero vendor lock-in | Self-hosting requires dedicated platform engineering expertise |
| Dynatrace | Agent-driven enterprise SaaS/hybrid | Managed SaaS or Self-Hosted Managed | Native OTLP ingestion + OneAgent | Zero-touch automatic discovery and deterministic topology root-cause analysis | Higher enterprise pricing and stronger proprietary agent coupling |
| New Relic | Unified telemetry database (NRDB) | Managed Cloud SaaS | Native OTLP endpoints | Predictable per-GB ingest pricing and flexible SQL-like NRQL querying | Full-user seat licensing can add cost for large engineering organizations |
| Honeycomb | High-cardinality wide-event engine | Managed Cloud SaaS | OpenTelemetry-first architecture | Sub-second exploratory debugging and automated BubbleUp anomaly isolation | Less focused on traditional host/network infrastructure monitoring |
| SigNoz | Unified ClickHouse-backed OTel platform | Self-Hosted (OSS) or SigNoz Cloud | 100% OpenTelemetry-native | Single open-source ClickHouse backend for metrics, traces, and logs | Younger enterprise ecosystem than Datadog or Grafana |
| Elastic Observability | Search-indexed document & metric store | Self-Hosted or Elastic Cloud | Native OTLP + Elastic APM agents | Unmatched full-text log search speed and combined SIEM security workflows | Heavy storage and RAM footprint for high-volume indexed logs |
Four Evaluation Factors That Prevent Telemetry Bill Shock
1. OpenTelemetry Collector First, Vendor SDKs Second
Instrumenting your application code directly with a vendor’s proprietary SDK locks your codebase to that vendor’s APIs. Standardize application instrumentation on OpenTelemetry (OTel) SDKs and route telemetry through an OpenTelemetry Collector pipeline—allowing you to drop noisy health-check spans, scrub PII, apply tail-based sampling, and switch or dual-ship backends without touching application code.
2. Custom Metric Cardinality Traps
Many commercial platforms charge steeply when a metric tag includes high-cardinality values (such as user_id, request_id, or pod_ip), because time-series databases create a separate time series for every unique label combination. Verify how a candidate platform prices high-cardinality attributes—and keep high-cardinality dimensions inside traces or structured wide events rather than Prometheus-style metrics.
3. Head-Based vs. Tail-Based Trace Sampling
Capturing 100% of distributed traces in a high-throughput system is prohibitively expensive. Head-based sampling decides whether to keep a trace at the start of a request (which risks dropping rare errors), whereas tail-based sampling buffers the entire trace and keeps 100% of error traces and high-latency outliers while sampling routine 200 OK traffic at 1–5%. Confirm whether your chosen platform or OpenTelemetry Collector topology supports tail-based sampling cleanly.
4. Log Indexing vs. Object-Storage Archiving
Paying full indexing rates for verbose debug logs that engineers rarely query wastes budget. Prioritize platforms that separate ingestion/archiving (cheap object storage for compliance and occasional hydration) from hot indexing (reserved strictly for error logs, audit trails, and critical service events).
Choosing the Right Observability Foundation
- For cloud-native teams seeking rapid turnkey setup and broad third-party integrations: Datadog or New Relic delivers immediate cross-signal visibility—with New Relic often proving easier to forecast when high host counts or custom metrics dominate workloads.
- For organizations prioritizing open standards, cost control, and architectural portability: Grafana Cloud (or self-hosted Grafana LGTM / SigNoz) pairs native OpenTelemetry ingestion with cost-effective object or columnar storage.
- For microservices teams debugging complex, high-cardinality production incidents: Honeycomb provides unmatched speed when isolating rare failure modes across millions of unique request dimensions.
- For large enterprises requiring automated instrumentation across legacy and hybrid estates: Dynatrace minimizes manual code instrumentation effort while mapping end-to-end service dependencies automatically.
