Every machine learning project starts cleanly—a single training script, a fixed dataset split, and a baseline validation score. Three weeks later, the team has run four hundred experiments across different learning rates, feature subsets, prompt templates, and model checkpoints, and nobody can prove which exact combination of code, hyperparameters, and training data produced the best checkpoint sitting in cloud storage.
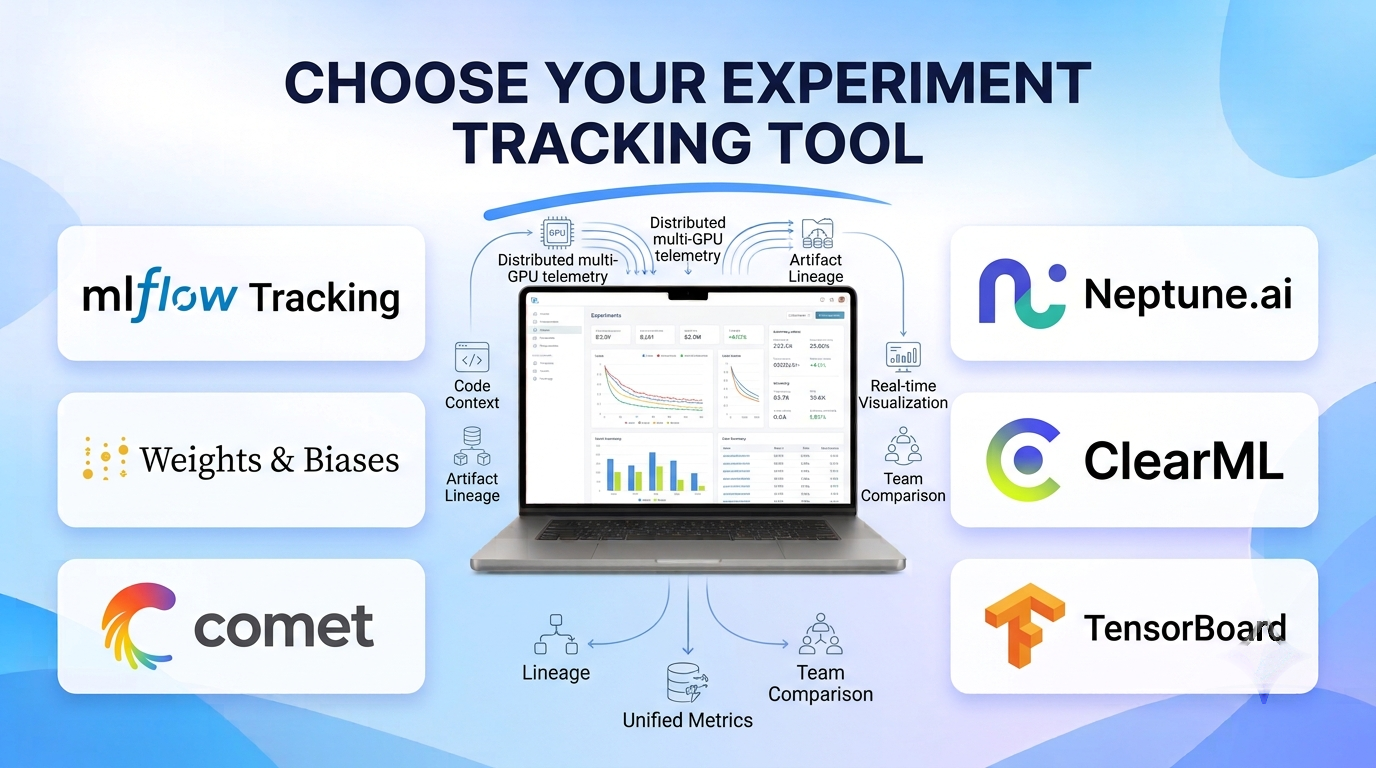
Experiment tracking tools replace fragile spreadsheets, ad-hoc print logs, and overwritten local folders with systematic telemetry. Choosing the right platform requires looking beyond basic loss curves to evaluate how each tool handles large artifact lineage, distributed multi-GPU logging overhead, self-hosted security boundaries, and team-wide comparison workflows.
What Distinguishes True Experiment Tracking From Simple Logging
Printing validation metrics to stdout or saving CSV logs captures numbers, yet it leaves critical reproducibility gaps. Production-grade experiment tracking captures four interconnected dimensions automatically:
- Execution Context: Exact Git commit hashes, dirty diff patches, Python environment dependencies (
pip freezeor Conda specs), hardware topology (GPU count, VRAM, driver versions), and command-line arguments. - Time-Series Telemetry: Step-by-step training and validation loss curves, gradient norms, learning rate schedules, and system utilization metrics (GPU memory, power draw, CPU load) streamed asynchronously without blocking training loops.
- Rich Media and Evaluation Artifacts: Confusion matrices, precision-recall curves, audio samples, segmentation masks, and LLM prompt-completion evaluation tables logged at specific epochs.
- Data and Artifact Lineage: Cryptographic hashes or version pointers linking each training run directly to the exact dataset snapshot and resulting model weights.
Leading Experiment Tracking Tools and Architectural Trade-Offs
MLflow Tracking
Governed under the Linux Foundation and deeply integrated across the data ecosystem, MLflow Tracking is the most widely adopted open-source standard for logging machine learning experiments. Using lightweight Python, R, Java, or REST APIs—alongside mlflow.autolog() integrations for PyTorch, scikit-learn, XGBoost, LightGBM, and Transformers—MLflow records parameters, metrics, tags, and model artifacts to local filesystems, SQL databases, or remote tracking servers backed by S3, GCS, or Azure Blob Storage.
Teams of every size rely on MLflow because it eliminates vendor lock-in and runs identically on a developer’s laptop, a self-hosted Kubernetes server, or inside managed Databricks and AWS SageMaker environments. The trade-off of self-hosting open-source MLflow is operational and UI polish: configuring enterprise authentication, role-based access control, and high-concurrency artifact storage requires internal DevOps setup, and its visualization interface is more utilitarian than commercial SaaS competitors.
Weights & Biases (W&B)
Weights & Biases sets the industry benchmark for developer ergonomics, real-time visualization, and collaborative experiment analysis. Plugging into existing PyTorch, JAX, TensorFlow, or Hugging Face training loops with a few lines of Python (wandb.init(), wandb.log()), W&B streams live loss curves, GPU hardware telemetry, interactive media tables, and parallel-coordinate hyperparameter sweep plots to a responsive web workspace.
AI research labs, foundation model teams, and fast-moving engineering organizations consistently favor W&B when comparing hundreds of parallel runs and debugging complex neural network training dynamics. Because W&B operates primarily as a commercial SaaS platform (with dedicated private-cloud/on-premises enterprise tiers), teams with strict air-gapped requirements or large seat counts must weigh recurring licensing costs against developer productivity gains.
Comet
Comet provides an enterprise-focused experiment management and model evaluation platform designed for both classical machine learning and generative AI workflows. Alongside automatic logging of hyperparameters, code diffs, system metrics, and custom visual panels, Comet offers strong comparative diffing tools—allowing engineers to inspect side-by-side differences between two runs’ code, hyperparameters, installed packages, and evaluation slices—as well as dedicated LLM prompt-tracing capabilities (Opik).
Enterprise data science teams and organizations operating across hybrid cloud and on-premises environments value Comet’s structured run-comparison UI, custom visualization panels, and flexible deployment options (cloud SaaS, VPC, or fully on-premises). Smaller teams seeking a purely self-managed open-source core will find Comet’s primary strengths centered in its commercial tiers.
Neptune.ai
Neptune.ai is a metadata-first experiment tracker engineered specifically for teams running massive, long-running training jobs and complex hierarchical experiments—such as foundation model pretraining, reinforcement learning, and large-scale computer vision. Built around a flexible key-value namespace structure rather than rigid flat tables, Neptune handles tens of thousands of logged series, high-frequency metrics, and massive checkpoint metadata smoothly without UI lag.
Foundation model builders and research-heavy ML teams running multi-day distributed training runs appreciate Neptune’s fast, responsive comparison tables and metadata scalability. Like W&B and Comet, Neptune is a commercial SaaS/enterprise product rather than an open-source self-hosted project.
ClearML
ClearML approaches experiment tracking as the entry point to an open-source, end-to-end MLOps platform. Adding two lines of Python (Task.init()) automatically captures Git repository state, uncommitted local code changes, Python packages, TensorBoard scalars, and console logs—while simultaneously packaging that execution context so the exact same experiment can be cloned, modified in the UI, and dispatched to remote GPU workers via ClearML’s built-in orchestration queue.
Engineering teams managing shared on-premises GPU servers or multi-cloud compute nodes gain high operational leverage from ClearML’s open-source server (clearml-server) and seamless transition from local tracking to remote execution. Its broad feature surface means teams looking strictly for a minimalist charting library may encounter more platform concepts than needed.
DVC (Data Version Control) and DVCLive
DVC takes a Git-native, decentralized approach to experiment tracking rather than relying on a centralized tracking database server. Using DVCLive alongside Git branches, commits, and tags, teams store lightweight metrics and parameters directly inside their Git repository while caching large datasets and model checkpoints in remote object storage (S3, GCS, Azure, SSH). Experiments appear directly inside Git pull requests and VS Code extensions without standing up external tracking servers.
Software engineers and smaller ML teams who want all code, data pointers, and experiment metrics unified inside existing GitHub or GitLab workflows—and who operate under strict network isolation—value DVC’s zero-server simplicity. When comparing thousands of concurrent hyperparameter runs visually across large cross-functional teams, centralized web UIs like W&B or Neptune scale more comfortably.
Aim
Aim is an open-source, self-hosted AI metadata and experiment tracking tool built specifically to handle high-volume training telemetry locally or on internal servers without SaaS dependencies. Featuring a fast web UI capable of querying and grouping thousands of runs using a Pythonic query language, Aim supports PyTorch, Hugging Face, Keras, and XGBoost integrations alongside system resource tracking and text/image logging.
Privacy-conscious teams and researchers wanting a modern, responsive, self-hosted open-source interface superior to basic TensorBoard logs—without paying SaaS seat fees—find Aim an appealing middle ground. Its enterprise support ecosystem is smaller than MLflow’s or commercial SaaS platforms.
TensorBoard
Included natively with TensorFlow and widely supported in PyTorch (torch.utils.tensorboard), TensorBoard remains the classic local visualization utility for inspecting scalar loss curves, weight histograms, computation graphs, and embedding projectors directly from local event files (tfevents).
Individual practitioners debugging single-machine training runs offline appreciate TensorBoard’s zero-configuration local startup. For multi-user team collaboration, hyperparameter comparison across hundreds of runs, and dataset lineage governance, TensorBoard lacks modern multi-tenant database capabilities.
Experiment Tracking Tool Comparison
| Tool | Hosting & Licensing | Core Architectural Strength | Team Collaboration & UI | Best Fit | Key Trade-Off |
| MLflow Tracking | Open-source (Apache 2.0) + Managed SaaS | Universal open standard; zero vendor lock-in | Functional run tables and metric charts | Organizations wanting portable, vendor-neutral tracking | Self-hosted auth and enterprise UI polish require extra setup |
| Weights & Biases | Commercial SaaS + Enterprise Private Cloud | Best-in-class real-time charts, sweeps, and media tables | Rich collaborative reports and shared workspaces | Deep learning research labs and fast-moving AI teams | Commercial per-seat/usage pricing scales with team size |
| Comet | Commercial SaaS, VPC, or On-Premises | Deep run-to-run diffing and custom visual panels | Strong enterprise evaluation and reporting views | Hybrid-cloud enterprise teams comparing complex experiments | Proprietary commercial platform rather than OSS core |
| Neptune.ai | Commercial SaaS + Enterprise Deployment | High-scale metadata engine for massive/long training runs | Fast filtering across thousands of high-frequency runs | Foundation model training and large-scale research teams | Commercial SaaS model; not designed for local-only OSS use |
| ClearML | Open-source core + Commercial Enterprise | Captures uncommitted code + clones runs to remote GPUs | Shared team dashboard with built-in job queues | Teams managing shared on-prem or cloud GPU clusters | Broader MLOps scope than pure metric-logging tools |
| DVC / DVCLive | Open-source (Apache 2.0) | Git-native experiment and dataset versioning (no server) | Integrates directly into GitHub/GitLab PR workflows | Git-centric engineering teams and air-gapped environments | Less suited for interactive visual comparison of 1,000+ runs |
| Aim | Open-source (Apache 2.0) self-hosted | Fast local/self-hosted UI for querying thousands of runs | Multi-run grouping and Pythonic query filtering | Teams wanting modern self-hosted UI without SaaS costs | Smaller ecosystem and enterprise support network |
| TensorBoard | Open-source (Apache 2.0) local utility | Instant local scalar, histogram, and graph inspection | Single-user local file viewer | Solo local debugging and quick sanity checks | Lacks multi-user governance, lineage, and team collaboration |
Four Evaluation Mistakes to Avoid
- Logging Metrics Without Dataset Fingerprints: Knowing that
Run #42achieved 94.2% F1 score is useless if the underlying training Parquet file was overwritten two weeks later. Always log dataset hashes, SQL query versions, or Delta/Iceberg table version numbers alongside hyperparameters. - Blocking Training Loops with Synchronous Network Calls: On multi-GPU clusters, poorly configured synchronous metric logging can stall GPU utilization while waiting for HTTP requests to complete. Verify that the client SDK buffers telemetry asynchronously in background threads.
- Ignoring Storage Growth from Heavy Checkpoints: Logging a 15-gigabyte model checkpoint every epoch across 200 experiments will rapidly exhaust object storage budgets. Configure retention policies to save only top-k checkpoints and final artifacts automatically.
- Treating Tracking as Governance: Experiment tracking records everything a data scientist tries—including failed hypotheses and quick hacks. Pair your tracker with a structured Model Registry so production deployment pipelines only pull vetted, approved candidates.
Choosing the Right Tracking Foundation
If your organization prioritizes open-source portability, broad framework compatibility, and clean integration with existing cloud infrastructure, MLflow Tracking—or DVC for strictly Git-centric teams—provides a durable, zero-lock-in foundation. When research velocity, interactive visualization of complex neural network internals, and cross-team collaboration justify commercial licensing, Weights & Biases, Neptune.ai, or Comet dramatically accelerates daily experimentation. Finally, teams looking for a modern, self-hosted open-source interface with zero external SaaS dependencies will find Aim or self-hosted ClearML immediately productive.
