Traditional Application Performance Monitoring (APM) tools like Datadog or New Relic tell you that an HTTP endpoint returned 200 OK in 1.4 seconds—they cannot tell you that an autonomous agent entered a five-step reasoning loop, retrieved outdated policy chunks, hallucinated a refund eligibility rule, and spent $0.42 in reasoning tokens before giving a confident wrong answer.
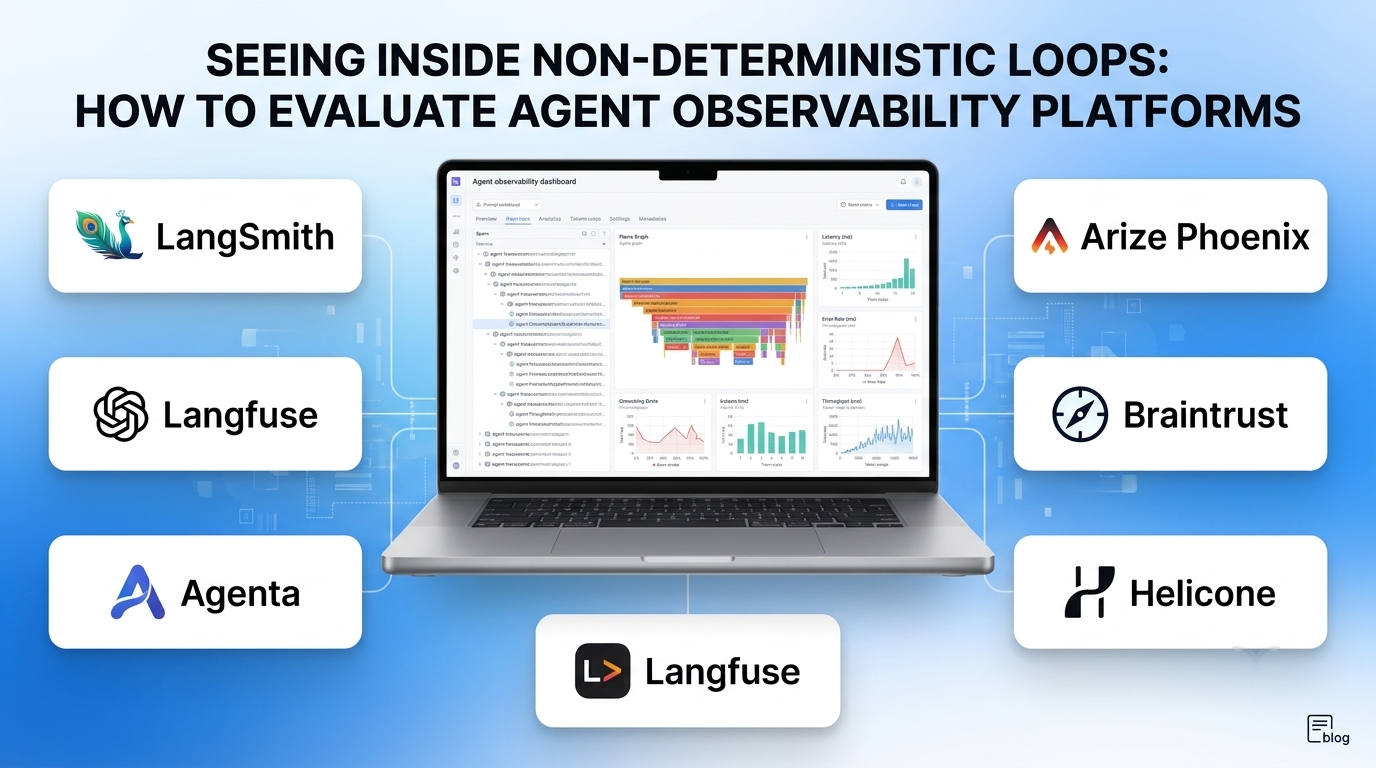
Agent observability platforms bridge that gap by capturing hierarchical execution traces across prompts, reasoning steps, retrieval queries, tool invocations, and multi-agent handoffs—and pairing live production telemetry with automated quality evaluations. Evaluating these platforms requires distinguishing framework-native debugging suites, OpenTelemetry-first open-source observability platforms, evaluation-driven engineering workspaces, and lightweight proxy loggers.
Five Capabilities That Separate Agent Observability From Basic LLM Logging
Logging raw prompt-response pairs is table stakes. Production agent observability requires five deeper capabilities:
- Nested Trajectory and Span Tracing: Agents execute trees of nested operations—parent session → planner step → retriever query → reranker → three sequential MCP tool calls → final synthesis. Platforms must render flame graphs and state diffs showing exact inputs, outputs, latency, and token costs at every node.
- OpenTelemetry (OTel) GenAI Semantic Convention Support: Locking telemetry into a proprietary SDK creates painful migration debt when switching orchestration frameworks. Platforms supporting OpenTelemetry GenAI conventions let teams instrument once and route traces cleanly across vendors.
- Online and Offline Evaluation Loops (LLM-as-a-Judge & Code Assertions): Observability without quality scoring leaves teams blind to silent regressions. Strong platforms run deterministic assertions (JSON schema validity, tool-argument accuracy) and calibrated LLM-as-a-judge evaluators (hallucination detection, context relevance, task completion) both in CI/CD before release and asynchronously on sampled production traffic.
- Trace-to-Dataset Curation: When an agent fails in production, engineers need one-click workflows to scrub PII, convert the failing trace into a labeled regression test case, and replay it against candidate prompts or models.
- Per-Tenant Cost Attribution and PII Redaction: Multi-tenant SaaS platforms require granular cost rollups by customer ID, feature flag, and model tier—alongside automated PII/PHI masking before payloads leave your VPC.
Leading Agent Observability Platforms
LangSmith
Developed by the creators of LangChain and LangGraph, LangSmith provides deep, native trace inspection, prompt playground replay, annotation queues, and dataset-driven evaluation workflows. While it integrates with zero friction into LangChain and LangGraph applications (automatically visualizing graph state transitions and node retries), it also accepts OpenTelemetry traces and SDK instrumentation from arbitrary Python and TypeScript stacks.
Teams running LangGraph in production gain unmatched visibility into cyclical agent state and human-review queues. Organizations requiring fully open-source, self-hosted licensing on entry tiers often compare LangSmith against Langfuse or Arize Phoenix.
Langfuse
Langfuse has emerged as the leading open-source (MIT-licensed) LLM engineering and agent observability platform, offering both a managed cloud service and straightforward Docker/Kubernetes self-hosting. Combining nested trace trees, session-level multi-turn views, versioned prompt management, user feedback tracking, and LLM-as-a-judge scoring, Langfuse gives engineering teams full ownership of their trace database (backed by Postgres and ClickHouse).
Privacy-conscious teams and startups wanting an open-source, framework-agnostic observability stack they can deploy inside their own VPC without per-seat lock-in frequently choose Langfuse.
Arize Phoenix (and Arize AX)
Arize Phoenix is an open-source, OpenTelemetry-native observability and evaluation toolkit built for AI engineers working across complex RAG pipelines, multi-agent systems, and hybrid ML workloads. Phoenix stands out for embedding-cluster visualization (helping teams spot retrieval drift and out-of-distribution queries), span-level OpenInference tracing across almost every major framework, and tight integration with Arize AX for enterprise-scale production monitoring.
Teams standardized on OpenTelemetry or combining classic ML ranking models with generative agents benefit from Phoenix’s vendor-neutral instrumentation.
Braintrust
Braintrust approaches observability from an evaluation-first engineering perspective—treating prompt and agent quality like unit and integration testing. Every production trace can be scored automatically, promoted into golden evaluation datasets, and benchmarked side-by-side in CI/CD pull requests with clear diffs showing where model or prompt changes improved or regressed accuracy.
Product engineering teams iterating rapidly on prompts, tool schemas, and model swaps who want tight CI/CD regression gates alongside live trace monitoring gravitate toward Braintrust.
Helicone
Helicone operates primarily as a lightweight, low-latency AI gateway and observability proxy. By changing a single base URL in OpenAI, Anthropic, or LiteLLM SDKs, teams immediately capture request/response logs, token spend, latency percentiles, semantic caching metrics, and rate limits across dozens of model providers with minimal code changes.
Teams needing rapid multi-provider cost tracking, caching, and request logging without heavy SDK instrumentation find Helicone fast to deploy. Deep multi-step agent graph visualization is less central than in LangSmith or Langfuse.
Galileo and Maxim AI (Enterprise Guardrails & Simulation)
- Galileo focuses heavily on real-time production reliability and safety guardrails—offering low-latency hallucination, PII, and prompt-injection detection models that can intercept unsafe agent responses before they reach end users.
- Maxim AI combines pre-release multi-turn persona simulation (stress-testing agents against simulated adversarial or confused users before launch) with post-release production tracing and quality alerts.
Agent Observability Platforms Comparison
| Platform | Instrumentation & Open Standards | Evaluation & Testing Strength | Hosting & Licensing | Key Differentiator | Primary Trade-Off |
|---|---|---|---|---|---|
| LangSmith | Native LangChain/LangGraph + OTel SDKs | Strong dataset replay, human annotation & online evals | Managed SaaS + Enterprise self-hosted | Deepest native state visibility for LangGraph agents | Commercial licensing for self-hosting |
| Langfuse | Python/JS SDKs, OpenAI wrappers & OpenTelemetry | Prompt versioning, user feedback & LLM-as-a-judge | Open-source (MIT) self-hosted + Cloud SaaS | Full self-hosted ownership with clean multi-turn trace UI | Teams configure custom agent-specific evaluators themselves |
| Arize Phoenix | OpenTelemetry / OpenInference native across frameworks | Retrieval/embedding drift analysis & span evals | Open-source (ELv2) + Arize AX Enterprise | Vendor-neutral OTel tracing & embedding cluster diagnostics | Enterprise governance features live in commercial AX tier |
| Braintrust | TypeScript/Python SDKs, proxy & OpenTelemetry | Best-in-class CI/CD eval diffs & side-by-side experiments | Managed Cloud + Hybrid/VPC deployment | Tightest loop between production failures and CI regression tests | Less focused on open-source self-hosting |
| Helicone | Single-line HTTP proxy + async logging SDKs | Basic online logging & cost/latency analytics | Open-source core + Managed Cloud | Sub-millisecond proxy setup with built-in caching & rate limits | Shallower multi-step agent state tree visualization |
| Galileo / Maxim AI | SDKs & API integrations | Real-time guardrails (Galileo) / persona simulation (Maxim) | Commercial SaaS + Enterprise VPC | Pre-release multi-turn simulation & inline safety blocking | Higher enterprise pricing than developer-first trace stores |
Avoiding Observability Blind Spots in Production
- Instrumenting LLM Calls Without Tool & Retriever Spans: Seeing the final prompt is useless if you cannot see the exact SQL query generated by a tool or the top-five chunks returned by your vector database. Wrap every retriever, reranker, and MCP tool invocation in a child span.
- Running Synchronous LLM Judges on the Critical Path: Executing a slow GPT-class evaluator synchronously before returning a response doubles user-facing latency. Run fast deterministic checks (regex, schema validation) inline, and execute LLM-as-a-judge scoring asynchronously on sampled production traces.
- Unbounded Trace Storage Costs: Logging full 100K-token document payloads and base64 screenshots on every trace quickly inflates observability bills. Configure sampling rules (100% of error traces, 5–10% of routine successes) and truncate large binary payloads.
Selecting the Right Agent Observability Platform
Match your observability stack to your orchestration layer and compliance boundaries:
- For Open-Source, Self-Hosted VPC Control: Deploy Langfuse or Arize Phoenix so sensitive prompts and customer data never leave your infrastructure.
- For LangChain / LangGraph Production Systems: Use LangSmith for zero-config state visualization and human annotation workflows.
- For Rapid Prompt & Model Iteration With CI/CD Regression Gates: Choose Braintrust to tie production traces directly to pull-request evaluation benchmarks.
- For Instant Multi-Provider Cost and Proxy Logging: Start with Helicone when you want unified spend visibility and caching in minutes.
