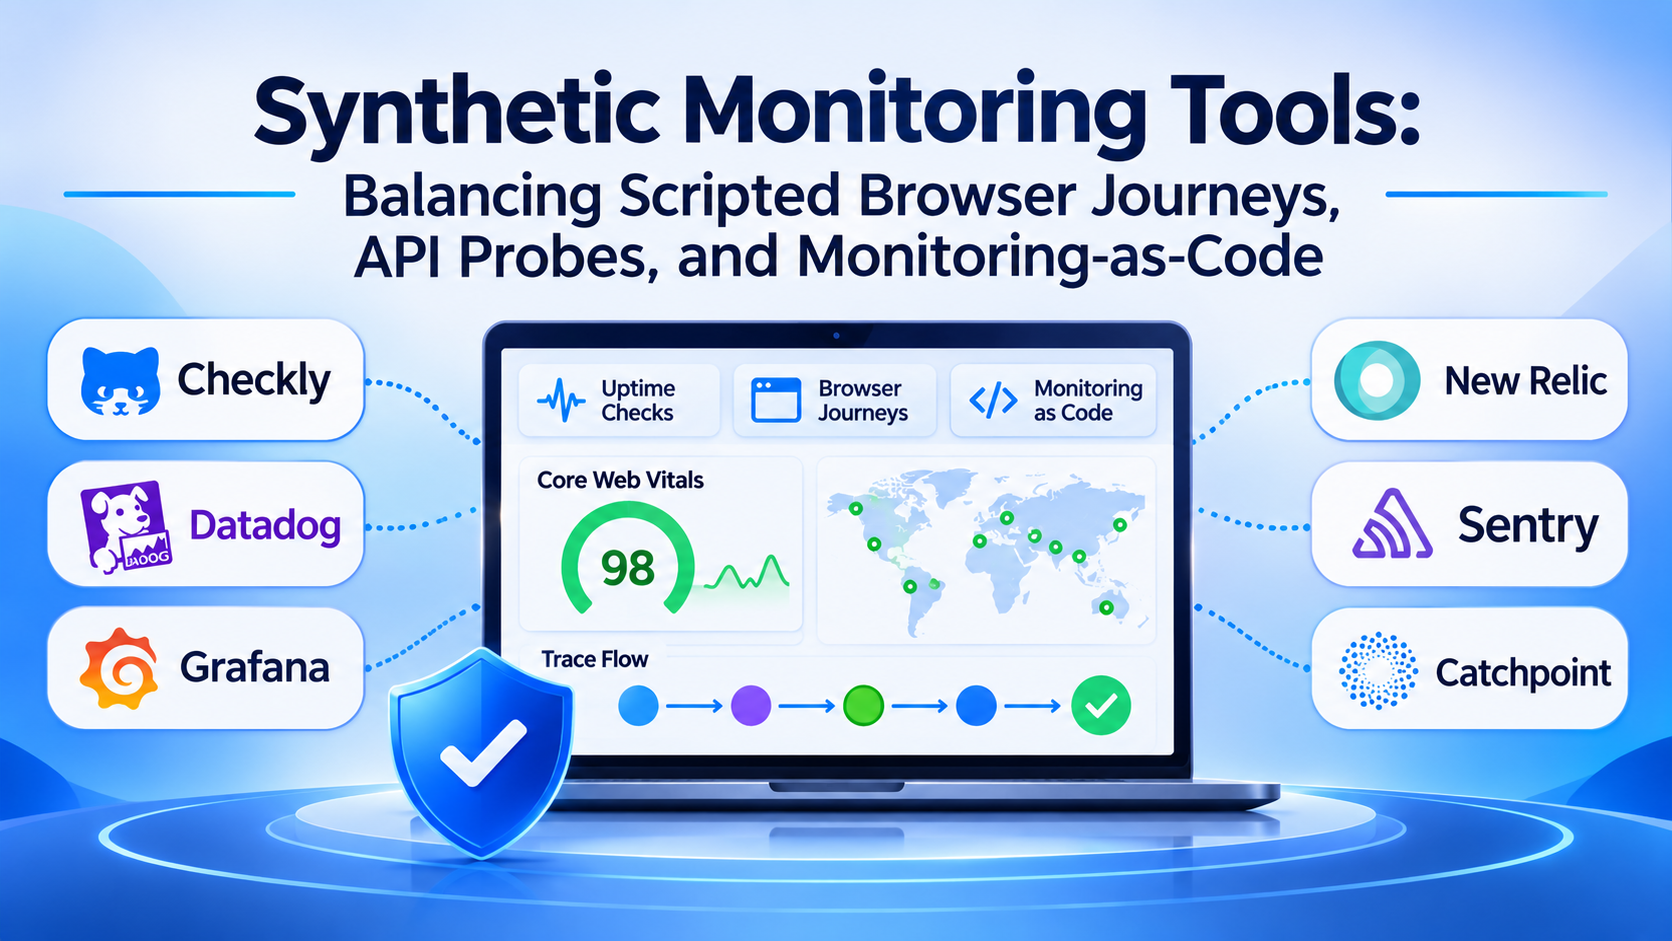
Real User Monitoring (RUM) relies on live customer traffic to surface latency and errors—which means when traffic drops overnight or a newly deployed DNS misconfiguration breaks login before customers wake up, RUM stays silent. Synthetic monitoring fills that blind spot by running scheduled, scripted transactions from global checkpoints or private network locations against your APIs, web applications, and DNS/TLS endpoints around the clock.
Yet teams evaluating synthetic monitoring tools often buy into the wrong execution model. Running heavyweight Chromium browser scripts every sixty seconds from twenty global regions to check a health endpoint inflates monthly test-run bills and produces noisy alerts whenever a third-party analytics script stalls. Conversely, simple HTTP ping checks miss single-page application (SPA) hydration failures, broken OAuth redirects, and expired TLS chains. Selecting the right platform requires matching probe complexity, private-location security, and Monitoring-as-Code workflows to what you actually need to verify.
Three Execution Tiers in Synthetic Monitoring
Before comparing vendors or open-source runners, engineering and SRE teams should separate the three distinct probe architectures used in synthetic testing.
1. Protocol and Network Availability Probes
Lightweight checks—HTTP(S), ICMP ping, TCP/UDP port checks, DNS resolution, and TLS certificate expiration probes—run in milliseconds with minimal compute overhead.
- Core strength: Ideal for high-frequency uptime verification, SLA tracking, and catching network-layer or certificate regressions immediately.
- Primary limitation: Cannot execute client-side JavaScript or validate multi-step user interfaces.
2. Multi-Step API and GraphQL Transaction Checks
Scripted API monitors chain sequential HTTP requests—authenticating via OAuth2, extracting a bearer token, posting a payload, asserting JSON schema and latency thresholds, and cleaning up test state.
- Core strength: Validates backend business logic, third-party webhook dependencies, and authentication flows cleanly without browser rendering overhead.
- Primary trade-off: Requires maintaining synthetic test accounts and isolated test data so scheduled writes do not pollute production analytics.
3. Headless Browser User Journeys (Playwright / Puppeteer / WebDriver)
Full-browser synthetic tests launch real Chromium, Firefox, or WebKit instances to simulate login flows, shopping carts, and dynamic SPA interactions—capturing screenshots, video recordings, HAR network waterfalls, and lab Core Web Vitals.
- Core strength: Catches broken frontend builds, third-party CDN script failures, and rendering regressions across desktop and mobile viewports.
- Primary trade-off: Significantly higher per-run billing in commercial SaaS platforms and greater sensitivity to minor CSS selector changes unless written with resilient locators.
Notable Synthetic Monitoring Tools Across Workflows
Checkly — Monitoring-as-Code Built on Playwright
Checkly is built specifically for modern engineering workflows that treat synthetic monitors like application code rather than click-ops configurations inside a web console. Using TypeScript or JavaScript CLI constructs (@checkly/cli), teams define API checks and multi-step Playwright browser checks right alongside application source code in Git, run them against preview environments on every pull request, and promote them to scheduled global production monitors.
Checkly’s tight alignment with Playwright allows developers to reuse existing end-to-end test helpers and resilient locators (getByRole, getByTestId) without learning a proprietary recorder DSL. It also supports private locations via containerized agents for internal endpoints. Its focus is squarely on developer-driven API and browser monitoring rather than legacy SNMP network infrastructure or mainframe protocols.
Datadog Synthetic Monitoring — Deep APM Trace Correlation and Self-Healing Locators
Datadog Synthetic Monitoring integrates API tests, multi-step API chains, browser tests, and mobile app tests directly into the Datadog observability platform. Its standout operational feature is APM trace integration: when a synthetic HTTP or browser check hits an instrumented backend service, Datadog injects trace headers so engineers can jump from a failed synthetic step directly into the backend distributed trace, database query span, and container logs.
Datadog also includes machine-learning-assisted self-healing selectors for browser tests (adapting when DOM attributes shift) and private location workers for testing internal staging applications behind corporate firewalls. Organizations must manage consumption carefully, as Datadog bills separately per 10,000 API test runs and 1,000 browser test runs.
Grafana Cloud Synthetic Monitoring (and Open-Source k6 / Blackbox Exporter)
Grafana offers two complementary open-standards pathways for synthetic monitoring:
- Prometheus Blackbox Exporter remains the open-source standard for self-hosted HTTP, HTTPS, DNS, TCP, and ICMP probing inside Kubernetes and Linux environments, exporting latency and TLS expiry metrics directly into Prometheus.
- Grafana Cloud Synthetic Monitoring builds on Grafana k6—allowing teams to run scheduled API and Playwright-based browser checks from global probe locations while storing execution metrics in Prometheus and logs in Loki.
Teams already invested in Prometheus, Loki, and Grafana gain unified alerting and dashboard correlation without introducing a separate commercial monitoring vendor.
New Relic Synthetics — Programmable Scripted Monitors in a Unified Telemetry Store
New Relic Synthetics provides ping monitors, simple browser checks, step-based low-code journeys, and fully scripted API and Chromium browser monitors written in JavaScript (using Selenium WebDriverJS-style APIs and Node modules).
For organizations using New Relic APM, synthetic check results live inside NRDB, allowing engineers to query synthetic failure rates alongside real-user browser telemetry and backend service errors using NRQL. Private minions can be deployed via Docker or Kubernetes to monitor internal intranet applications.
Catchpoint — Deep Internet Stack and BGP/DNS Path Visibility
While most APM vendors focus on application endpoints, Catchpoint specializes in Internet Performance Monitoring—operating an extensive global network of backbone, broadband, last-mile ISP, and wireless carrier probe nodes.
Catchpoint excels at diagnosing issues outside your data center: BGP route hijacks, regional ISP peering degradation, DNS propagation failures, and third-party CDN bottlenecks affecting specific geographic markets. It is widely used by global e-commerce, media, and financial enterprises where regional internet path health is critical, though its enterprise pricing and network-centric depth exceed what typical SaaS startups require.
Pingdom (SolarWinds) and UptimeRobot — Accessible Uptime and Basic Transaction Checks
For small-to-midsize teams seeking straightforward external availability monitoring without complex observability suites:
- Pingdom offers approachable uptime checks, page-speed waterfall analysis, and recorded transaction monitoring with clear alerting integrations.
- UptimeRobot provides cost-effective, high-frequency HTTP(S), keyword, port, and cron-heartbeat monitoring with simple status pages—ideal for small websites and indie services, though lacking deep Playwright-style SPA scripting or distributed APM trace correlation.
Comparison of Synthetic Monitoring Tools
| Tool / Platform | Core Probe Types | Configuration & Authoring | Private Network Support | Standout Strength | Primary Trade-Off |
| Checkly | API chains & Playwright browser journeys | Monitoring-as-Code (TS/JS CLI) + Web UI | Yes (Docker/Kubernetes agent) | Native Playwright reuse, GitOps workflows, and CI preview-environment checks | Focused on modern web/API stacks rather than deep network/BGP telemetry |
| Datadog Synthetics | API, multi-step API, browser, & mobile | Web recorder + Terraform/API | Yes (containerized private locations) | Direct jump from failed synthetic step to backend APM distributed traces | Per-run browser test pricing escalates quickly at high frequencies |
| Grafana Synthetics / k6 | HTTP/DNS/TCP, k6 API scripts, & browser | k6 JavaScript + Prometheus Blackbox Exporter | Yes (self-hosted agents / OSS) | Seamless integration with Prometheus/Loki and open-source k6 ecosystem | Less turnkey visual recorder polish than dedicated commercial DXI suites |
| New Relic Synthetics | Ping, scripted API, & Chromium browser | JS scripts, step builder, & Terraform | Yes (containerized private minions) | Unified NRQL querying across synthetic checks, RUM, and backend APM | Browser scripting relies on older WebDriver conventions rather than native Playwright |
| Catchpoint | HTTP, browser, DNS, BGP, traceroute, & API | Web UI & API | Yes (enterprise nodes + global ISP nodes) | Unmatched global ISP/last-mile visibility and internet routing diagnostics | Enterprise pricing and network-engineering focus |
| UptimeRobot / Pingdom | HTTP(S), keyword, port, & basic transactions | Web UI | Limited / SaaS-focused | Fast setup and low-cost availability alerting for small teams | Lacks deep SPA scripting, code-first Git workflows, and APM trace links |
Four Practices That Keep Synthetic Suites Reliable and Affordable
1. Run High-Frequency API Checks and Low-Frequency Browser Journeys
Do not run a full headless Chromium checkout flow every 60 seconds from ten regions. Run lightweight API health and authentication checks every 1–2 minutes to catch outages immediately, and schedule full browser journeys every 10–15 minutes (or immediately post-deployment) to verify frontend rendering without multiplying compute costs.
2. Isolate Synthetic Test Data from Production Analytics
Synthetic checkout and sign-up scripts running every five minutes generate thousands of synthetic database records per month. Use dedicated test tenant accounts, synthetic user flags (is_synthetic: true), or sandbox payment tokens so automated probes never distort business revenue metrics or trigger outbound customer emails.
3. Block or Mock Uncontrolled Third-Party Scripts in Browser Monitors
If your synthetic login check fails at 3:00 AM because an external marketing chat widget or ad pixel timed out, your on-call engineer gets paged for a third-party outage you cannot fix. Configure browser monitors to either isolate third-party domains into non-alerting performance budgets or block non-essential third-party analytics domains during availability checks.
4. Reuse Synthetic Checks as Post-Deploy CI Gates
Rather than maintaining separate end-to-end tests in CI and synthetic scripts in production, choose a tool—such as Checkly or Grafana k6—that lets you trigger the exact same Playwright or API checks against ephemeral staging/preview URLs before promoting a release to production.
Choosing the Right Synthetic Monitoring Tool
- For developer-led engineering teams practicing Monitoring-as-Code: Checkly delivers the cleanest Git-native workflow by letting teams author, version, and run Playwright browser and API checks directly from TypeScript/JavaScript repositories.
- For organizations already consolidated on Datadog or New Relic: Datadog Synthetic Monitoring or New Relic Synthetics eliminates tool sprawl and connects synthetic probe failures directly to backend APM traces.
- For Kubernetes and open-source Prometheus/Grafana teams: Combine Prometheus Blackbox Exporter for low-overhead protocol/TLS checks with Grafana k6 for scripted API and browser journeys.
- For global enterprises diagnosing regional ISP, DNS, and BGP internet bottlenecks: Catchpoint provides unmatched visibility across carrier and backbone networks worldwide.
