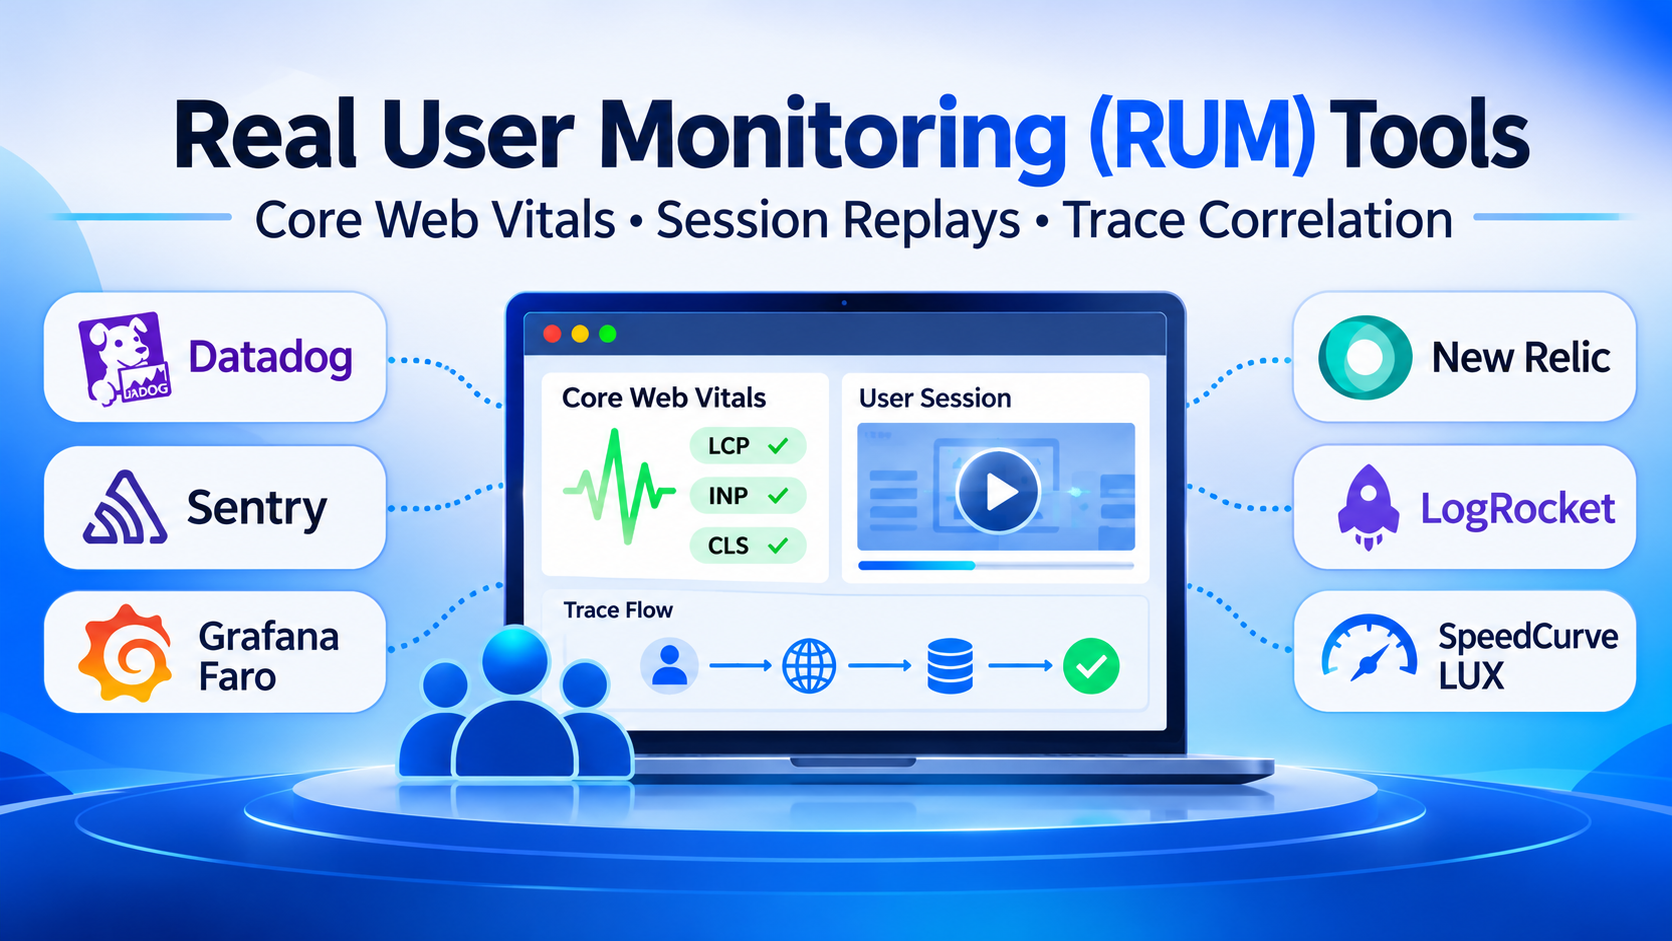
Synthetic Lighthouse audits run on fast fiber connections and clean desktop VMs routinely report green scores while real users on mid-tier Android phones over congested cellular networks abandon a checkout flow due to frozen main-thread interactions or failing GraphQL mutations. Synthetic testing measures lab potential; Real User Monitoring (RUM) captures how actual customers experience your web and mobile applications across real devices, geographies, browser versions, and network conditions.
However, the RUM market spans sharply different engineering and business priorities. Some platforms focus strictly on lightweight Core Web Vitals and performance telemetry with negligible bundle-size overhead; others bundle DOM session replay, heatmaps, and conversion funnels aimed at product managers and UX teams; and full-stack observability suites wire browser and mobile SDKs directly into backend distributed traces (traceparent headers) so an engineer can click from a slow frontend button tap straight into the backend database span that stalled it. Selecting the right RUM tool requires balancing SDK bundle weight, session-volume pricing, privacy redaction rigor, and frontend-to-backend trace correlation.
Three Distinct Approaches to Real User Monitoring
Before comparing individual products, frontend, mobile, and observability teams should determine which operational model matches their primary diagnostic bottleneck.
1. Full-Stack Observability RUM (Trace-Correlated Telemetry)
Platforms such as Datadog RUM, New Relic Browser/Mobile, Dynatrace, and Grafana Faro inject W3C Trace Context headers into outgoing fetch and XMLHttpRequest calls.
- Core strength: Connects frontend user actions (clicks, route transitions, API errors) directly to backend APM traces, allowing engineers to distinguish slow client-side JavaScript rendering from slow backend microservices.
- Primary trade-off: Session-based commercial pricing can become expensive on high-traffic consumer sites unless sampling rates are tuned carefully.
2. Lightweight Web Vitals and Speed-Focused RUM
Tools like SpeedCurve LUX, Vercel Speed Insights, Cloudflare Web Analytics, and open-source web-vitals pipelines focus on capturing Google Core Web Vitals—Largest Contentful Paint (LCP), Interaction to Next Paint (INP), and Cumulative Layout Shift (CLS)—alongside Navigation Timing and Resource Timing metrics with ultra-small JavaScript footprints.
- Core strength: Minimal impact on client-side CPU and network bandwidth, paired with clear SEO and conversion-rate performance benchmarking.
- Primary trade-off: Lacks visual session replay and deep backend distributed trace correlation.
3. Digital Experience Analytics and Session Replay Suites
Platforms such as FullStory, LogRocket, PostHog, and Contentsquare record DOM mutations, console logs, network payloads, rage clicks, and user journeys alongside performance timings.
- Core strength: Lets developers and product teams watch exact visual reproductions of user sessions leading up to an unhandled exception or checkout drop-off.
- Primary trade-off: Higher client-side script overhead and strict privacy/compliance requirements (GDPR, HIPAA, PCI DSS) around masking sensitive form inputs and PII before data leaves the browser.
Notable Real User Monitoring Tools Across Workflows
Datadog RUM — End-to-End Frontend-to-Backend Correlation and Session Replay
Datadog RUM pairs browser and native mobile SDKs (iOS, Android, React Native, Flutter) with Core Web Vitals tracking, JavaScript error monitoring, frustration signals (rage clicks, dead clicks), funnel analytics, and optional Session Replay.
Its defining architectural advantage is tight integration with Datadog APM and Log Management: when a user experiences a failed API request or slow page transition, engineers can jump directly from the RUM resource span to the exact backend distributed trace and server logs. Its primary operational consideration is billing structure—Datadog meters RUM by 1,000 sessions (with higher tiers when Session Replay is enabled), making head-based or error-triggered session sampling important on high-volume public websites.
New Relic Browser and Mobile — Unified Telemetry Under Ingest Pricing
New Relic provides browser monitoring (injectable via lightweight JavaScript snippet or automated APM agent injection) alongside native mobile SDKs for iOS, Android, and hybrid frameworks. It captures Core Web Vitals, AJAX request timings, JavaScript stack traces, and distributed trace links into New Relic APM.
For organizations already using New Relic for backend observability, Browser and Mobile RUM integrate into the same NRDB telemetry store and NRQL query engine—allowing teams to correlate frontend latency spikes with backend deployments or regional CDN degradation under New Relic’s data-ingest pricing model rather than managing a separate frontend vendor contract.
Sentry — Developer-First Frontend Performance, Errors, and Replays
Built around developer debugging workflows, Sentry combines real-time JavaScript/mobile crash reporting with performance tracing (Web Vitals, cold/warm mobile app starts, slow UI renders), network span propagation to backend Sentry traces, and privacy-first Session Replay.
Sentry’s strength lies in actionable engineering context: tying slow LCP or INP regressions directly to source-mapped stack traces, Git commit authors, and release versions. It is particularly effective for product engineering teams that want unified error and performance visibility without deploying heavyweight enterprise digital-experience suites.
Grafana Faro — Open-Source Frontend Observability for OpenTelemetry Stacks
Maintained by Grafana Labs, Grafana Faro is an open-source Web SDK and collector pipeline designed to bring real user monitoring into Prometheus, Loki, and Tempo ecosystems. Faro captures Core Web Vitals, console logs, unhandled exceptions, user interactions, and OpenTelemetry trace spans—forwarding telemetry to Grafana Cloud Frontend Observability or a self-hosted Grafana Alloy collector.
Faro is an ideal fit for teams standardized on open-source observability that want to correlate browser sessions with Grafana Tempo traces and Loki logs without paying per-session commercial RUM markups. Its mobile SDK coverage and product-analytics features are narrower than mature commercial platforms like Datadog or FullStory.
LogRocket — Engineering-Grade Session Replay and State Inspection
LogRocket bridges product experience analytics and deep frontend debugging. Alongside video-like DOM session playback, LogRocket captures Redux/Vuex/NgRx application state diffs, network request/response headers, console output, Core Web Vitals, and frustrating UX patterns.
Unlike marketing-oriented heatmap tools, LogRocket is built specifically for frontend engineers reproducing elusive state bugs reported by customer support. Teams operating in regulated healthcare or financial domains can utilize its strict client-side DOM redaction controls or self-hosted deployment options, though script weight and session-tier pricing warrant testing on performance-sensitive pages.
SpeedCurve LUX — Dedicated Web Performance Benchmarking
SpeedCurve LUX focuses strictly on real-user web performance engineering rather than general error tracking or backend APM. Built on top of Boomerang and standard browser Performance Observer APIs, SpeedCurve pairs RUM data with synthetic Lighthouse/WebPageTest benchmarks in the same interface—allowing performance engineers to correlate LCP, INP, and custom user timings directly against business conversion metrics and deploy budgets.
Its laser focus on web speed makes it a favorite among e-commerce and media performance teams, though organizations seeking mobile app monitoring or distributed backend tracing will still need a broader observability suite.
Cloudflare Web Analytics and Vercel Speed Insights — Edge-Native Lightweight Telemetry
For teams hosting sites on Cloudflare or Vercel who want immediate Core Web Vitals visibility with minimal setup:
- Cloudflare Web Analytics offers privacy-first, cookieless RUM that measures Core Web Vitals and page-load timings across browser versions and countries without injecting heavy tracking scripts or harvesting personal user data.
- Vercel Speed Insights provides framework-aware Core Web Vitals monitoring (particularly for Next.js applications), grouping real-user LCP, INP, and CLS scores by dynamic route patterns (
/products/[slug]) so teams can pinpoint slow templates immediately after a deployment.
Comparison of Real User Monitoring (RUM) Tools
| Tool / Platform | Primary Focus | Supported Platforms | Frontend-to-Backend Trace Link | Session Replay | Primary Trade-Off |
| Datadog RUM | Full-stack observability & UX monitoring | Web, iOS, Android, React Native, Flutter | Native W3C Trace Context to Datadog APM | Yes (add-on tier) | Per-session billing requires disciplined sampling on high-traffic sites |
| New Relic Browser/Mobile | Full-stack telemetry & NRQL analytics | Web, iOS, Android, Hybrid mobile | Native W3C Trace Context to New Relic APM | Yes | Less specialized for product-team UX heatmaps than dedicated DXI tools |
| Sentry | Developer error & performance debugging | Web, iOS, Android, React Native, Flutter, Unity | Native distributed tracing to backend SDKs | Yes (with strict default PII masking) | Focused on developer debugging rather than marketing funnel analytics |
| Grafana Faro | Open-source OTel frontend observability | Web (Browser JS/TS) | Native OpenTelemetry (OTLP) to Tempo | No | Web-focused; fewer out-of-the-box product analytics than commercial suites |
| LogRocket | Engineering session replay & app state debugging | Web, iOS, Android, React Native | Integrates with Datadog, Sentry, & New Relic traces | Core capability (DOM + Redux/network state) | Higher client-side overhead if full DOM recording is enabled on all sessions |
| SpeedCurve LUX | Web performance & Core Web Vitals engineering | Web (Browser) | Custom resource timing correlation | No | Web performance only; no native mobile SDKs or backend APM |
| Cloudflare Web Analytics | Lightweight privacy-first Core Web Vitals | Web (Browser) | No | No | Basic page-level metrics; lacks error stack traces and session diagnostics |
Four Technical Pitfalls in RUM Implementation
1. Observer Effect: Slowing Down the Page You Are Measuring
A poorly optimized RUM or session-replay script can consume main-thread CPU during page load—degrading the very Interaction to Next Paint (INP) score you are trying to improve. Always verify that your RUM SDK loads asynchronously (async/defer), batches telemetry beacons via navigator.sendBeacon(), and keeps compressed script weight minimal.
2. Missing Timing-Allow-Origin Headers on Cross-Origin Assets
By default, browsers restrict detailed ResourceTiming metrics (DNS lookup, TCP handshake, TLS negotiation, TTFB) for scripts, fonts, and API calls served from external CDNs or subdomains unless the server returns an explicit Timing-Allow-Origin HTTP response header. Without that header, your RUM dashboard will report 0ms for network phases and hide CDN bottlenecks.
3. Unmasked PII Inside DOM Session Replays and URLs
Session replay scripts record DOM text nodes, input events, and URL query strings. Without strict allow-listing or default masking (maskAllText, blockAllMedia), a RUM SDK can inadvertently transmit customer passwords, credit card numbers, health records, or session tokens in URLs to third-party servers. Always configure client-side scrubbing rules before enabling session capture in production.
4. Averaging Metrics Instead of Tracking the 75th and 95th Percentiles
Google evaluates Core Web Vitals at the 75th percentile (p75) of real user page loads, while critical API errors often hide in the 95th or 99th percentile (p95/p99). Avoid RUM dashboards that highlight mean (average) load times, which mask severe performance regressions experienced by mobile users on slower devices.
Choosing the Right RUM Tool for Your Stack
- For engineering organizations wanting unified frontend-to-backend distributed tracing: Standardize on Datadog RUM, New Relic Browser/Mobile, or Sentry—favoring Sentry when developer error-to-trace velocity is top priority, and Datadog or New Relic when enterprise infrastructure observability is already consolidated there.
- For teams committed to OpenTelemetry and open-source observability: Adopt Grafana Faro to pipe browser Core Web Vitals, errors, and trace spans directly into Grafana Tempo and Loki.
- For product and frontend teams reproducing complex UI and state bugs: Pair LogRocket (with strict PII masking and error-triggered sampling) alongside your backend APM trace IDs.
- For performance-obsessed web teams optimizing Core Web Vitals and conversion rates: SpeedCurve LUX (or Vercel Speed Insights / Cloudflare Web Analytics for lightweight edge setups) delivers clear p75 web speed telemetry without heavy SDK overhead.
