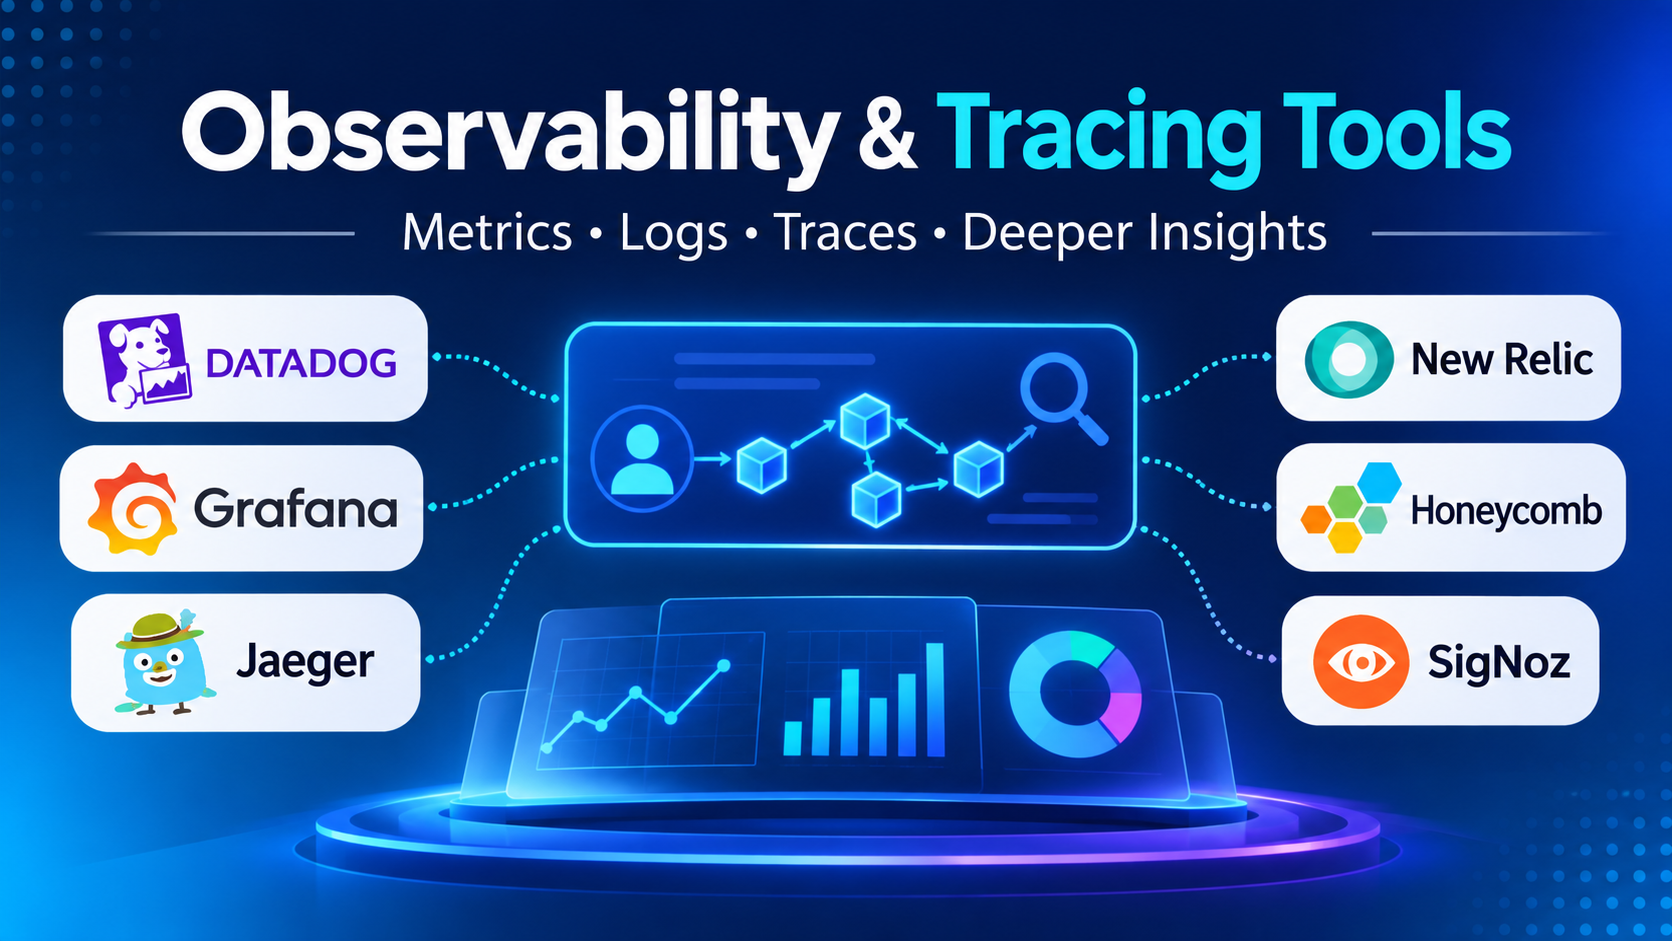
When a single user checkout triggers forty asynchronous calls across API gateways, authentication services, Kafka queues, and database shards, aggregate latency metrics lose their explanatory power. Knowing that average response time doubled tells an on-call engineer nothing about which downstream service stalled—or whether a retry storm in one microservice cascaded across the entire request path.
Distributed tracing tools reconstruct end-to-end execution timelines by propagating a shared trace context across process and network boundaries, assembling individual operations (“spans”) into causal flame graphs. Yet choosing a distributed tracing backend involves critical architectural trade-offs. Recording every span at high traffic volume overwhelms storage budgets, naive sampling silently drops the rare error traces you actually need, and proprietary instrumentation agents can lock your codebase into a single vendor. Evaluating tracing platforms requires examining how they ingest OpenTelemetry data, support tail-based sampling, and index trace attributes at scale.
How Distributed Tracing Architectures Differ
Although the OpenTelemetry (OTel) specification and W3C Trace Context headers have standardized how applications generate and propagate trace spans, tracing backends diverge sharply in how they store and query that telemetry.
1. Dedicated Open-Source Tracing Backends
Standalone systems such as Jaeger and Zipkin focus specifically on ingesting, storing, and visualizing distributed traces—typically writing span data to Elasticsearch, OpenSearch, Apache Cassandra, or object storage.
- Core strength: Clean, purpose-built trace waterfall views, service dependency graphs, and zero per-span licensing fees.
- Primary trade-off: Operate primarily as trace-only UIs; correlating a slow span with host CPU metrics or container logs requires jumping to separate dashboards unless wired via exemplar links.
2. Object-Storage-Backed Trace Engines
Modern tracing engines like Grafana Tempo eliminate expensive full-text tag indexing altogether. Instead, they store compressed trace batches directly in inexpensive cloud object storage (Amazon S3, Google Cloud Storage, Azure Blob) and maintain lightweight Parquet/index headers for trace ID and tag lookups.
- Core strength: Dramatically reduces storage costs at high trace volumes and integrates natively with Prometheus exemplars and Loki logs inside Grafana.
- Primary trade-off: Complex multi-attribute analytical queries across millions of historical traces run slower than in columnar analytical databases unless scoped by service and time range.
3. Unified Observability and High-Cardinality Analytics Backends
Commercial SaaS platforms (Honeycomb, Datadog APM, Dynatrace) and ClickHouse-backed open-source platforms (SigNoz, HyperDX) ingest traces alongside metrics and logs into unified analytical stores.
- Core strength: Allows engineers to run arbitrary
GROUP BYaggregations across high-cardinality span tags (such ascustomer_id,region, orfeature_flag) and pivot directly from trace spans to code profiles and logs. - Primary trade-off: Commercial SaaS tiers bill by ingested span volume or host count, making intelligent sampling rules mandatory to keep budgets predictable.
Notable Distributed Tracing Tools Across Ecosystems
Jaeger — The CNCF Standard for Open-Source Distributed Tracing
Originally created at Uber and graduated under the Cloud Native Computing Foundation (CNCF), Jaeger is one of the most widely deployed open-source distributed tracing backends. It natively ingests OpenTelemetry (OTLP), Jaeger, and Zipkin protocols, rendering clear request waterfall timelines, critical-path highlights, and dynamic service dependency diagrams.
Jaeger supports multiple storage backends—including Elasticsearch, OpenSearch, Apache Cassandra, and Badger (for lightweight single-node setups)—and includes built-in Service Performance Monitoring (SPM) views that derive RED metrics (Request rate, Error rate, Duration) directly from trace spans. Its main operational consideration is storage administration: running Jaeger at high scale requires maintaining and tuning the underlying search or NoSQL cluster.
Grafana Tempo — High-Scale Tracing on Inexpensive Object Storage
Built by Grafana Labs, Grafana Tempo was engineered around a single architectural premise: distributed tracing should be cheap enough that teams do not have to discard 99% of their traffic before storage. Tempo achieves this by requiring only an object-storage bucket (S3, GCS, or Azure Blob) rather than an Elasticsearch or Cassandra cluster.
Through TraceQL (a query language modeled after PromQL and LogQL) and deep integration with Prometheus Exemplars, engineers can click directly on a latency spike in a Prometheus graph and open the exact corresponding trace in Grafana. Tempo excels in Kubernetes environments already standardized on Prometheus and Loki, though teams seeking standalone trace analytics without the broader Grafana stack will find Jaeger or SigNoz more self-contained.
Zipkin — Lightweight, Low-Overhead Tracing for JVM and Microservice Stacks
Pioneered at Twitter and inspired by Google’s Dapper paper, Zipkin remains a straightforward, lightweight open-source tracing server distributed as a single runnable JAR or Docker container.
Zipkin’s simplicity makes it easy to spin up locally or in smaller production clusters, supporting in-memory, MySQL, Cassandra, and Elasticsearch storage backends. While Jaeger and Grafana Tempo have overtaken Zipkin in large cloud-native Kubernetes deployments, Zipkin’s wire format remains widely supported across legacy Spring Cloud Sleuth and polyglot microservices.
Honeycomb — Exploratory High-Cardinality Trace Analytics
Honeycomb treats distributed trace spans as rich, structured wide events rather than simple timing bars. Instead of pre-aggregating dashboards, engineers query raw span attributes interactively—slicing latency distributions by arbitrary combinations of user_id, endpoint, db.statement, and build_id in seconds.
Its BubbleUp capability automatically compares slow or failing spans against healthy baseline spans across all attached metadata fields to surface hidden correlations immediately. Honeycomb is built natively around OpenTelemetry and excels for engineering teams debugging unpredictable microservices behavior, though its commercial SaaS pricing scales with monthly event volume.
SigNoz — Open-Source ClickHouse-Powered Tracing and APM
For teams wanting unified trace waterfalls, latency histograms, span-attribute filtering, and log correlation in a single self-hosted tool, SigNoz stores OpenTelemetry traces inside ClickHouse.
Because ClickHouse is a columnar analytical database, SigNoz supports fast filtering and aggregations across high-cardinality span tags without requiring separate Elasticsearch and Prometheus deployments. Teams can self-host the open-source edition via Helm or Docker, or use SigNoz Cloud for managed operations.
AWS X-Ray and Cloud-Native Tracing Services (Cloud Trace / Azure Monitor)
For organizations deeply invested in a single public cloud provider, managed tracing services offer zero-infrastructure setup:
- AWS X-Ray (integrated within Amazon CloudWatch) automatically traces requests passing through API Gateway, AWS Lambda, ALB, ECS, SQS, and DynamoDB, visualizing service maps with minimal configuration.
- Google Cloud Trace and Azure Monitor Application Insights provide equivalent native trace ingestion (including OpenTelemetry OTLP endpoints) tightly bound to GCP and Azure IAM permissions.
Cloud-native tracing services work well for serverless and managed cloud architectures, though teams running hybrid or multi-cloud Kubernetes workloads often prefer vendor-neutral backends like Grafana Tempo or Honeycomb to avoid fragmented visibility.
Comparison of Distributed Tracing Tools
| Tool / Platform | Backend Storage Model | Deployment Options | Query & Analysis Focus | Standout Strength | Primary Trade-Off |
| Jaeger | Elasticsearch, OpenSearch, Cassandra | Self-Hosted (Open Source, CNCF) | Waterfall views, critical path, & RED metrics | Mature open-source standard with native OTLP support and service maps | Requires operating and scaling a search or NoSQL storage backend |
| Grafana Tempo | Object storage (S3, GCS, Azure Blob) | Self-Hosted (OSS) or Grafana Cloud | TraceQL + Prometheus/Loki correlation | Extremely low storage cost at high volume; zero external index DB required | Best experienced inside the broader Grafana observability ecosystem |
| Zipkin | In-memory, MySQL, Cassandra, Elasticsearch | Self-Hosted (Open Source) | Simple trace lookup & dependency graph | Fast single-JAR deployment and minimal operational footprint | Fewer advanced analytical and high-cardinality query capabilities |
| Honeycomb | Custom columnar wide-event store | Managed Cloud SaaS | Interactive high-cardinality slicing & BubbleUp | Rapid root-cause isolation across millions of unique span attributes | Commercial SaaS billing tied to monthly ingested span volume |
| SigNoz | ClickHouse columnar database | Self-Hosted (OSS) or SigNoz Cloud | Unified trace analytics, metrics, & logs | Fast high-cardinality span queries and unified APM views in one open-source stack | ClickHouse cluster sizing requires planning at massive scale |
| AWS X-Ray | Managed AWS storage | Managed AWS Cloud Service | Service maps & AWS-managed service latency | Turnkey integration with Lambda, API Gateway, SQS, and ECS | Tightly scoped to AWS ecosystems; less ergonomic for multi-cloud stacks |
Four Implementation Challenges That Break Distributed Tracing
1. Broken Context Propagation Across Message Queues and Threads
Distributed tracing relies on passing traceparent headers from caller to callee. While HTTP clients and gRPC interceptors handle this automatically, traces frequently fracture into disconnected orphan spans across asynchronous message brokers (Kafka, RabbitMQ, SQS), background job queues, and manual thread pools. Always verify that your instrumentation injects trace context into message headers on publish and extracts it cleanly on consume.
2. Head-Based Sampling Dropping Rare Production Errors
In high-traffic systems, sampling 1% of requests at the ingress gateway (head-based sampling) keeps costs low—but it also discards 99% of intermittent errors and slow tail-latency outliers. Deploy the OpenTelemetry Collector with the Tail Sampling Processor so your pipeline buffers active traces briefly in memory, retaining 100% of error traces and high-latency spans while downsampling routine healthy requests.
3. Unbounded Span Cardinality and Sensitive Payload Leaks
Attaching full SQL query strings containing raw customer names, credit card numbers, or unbounded URL paths (/users/12345/orders/98765) as span names turns every request into a unique operation and risks compliance violations. Normalize span names using parameterized route templates (/users/{id}/orders/{orderId}) and configure redaction processors in your OpenTelemetry Collector before export.
4. Ignoring Clock Skew Across Distributed Hosts
Because child spans are recorded on different virtual machines or container nodes than parent spans, slight NTP clock drift between servers can render child spans starting before their parent span finishes. Ensure all cluster nodes synchronize clocks via NTP/Chrony and verify how your tracing UI visualizes minor clock-skew adjustments.
Choosing the Right Distributed Tracing Stack
- For Kubernetes teams standardized on Prometheus and Grafana: Adopt Grafana Tempo backed by S3-compatible object storage to capture high trace volumes economically with seamless metric-to-trace jumping.
- For teams wanting a standalone, open-source tracing UI or unified ClickHouse backend: Deploy Jaeger when you already operate OpenSearch/Elasticsearch, or SigNoz when you want unified traces, metrics, and logs inside a single open-source ClickHouse store.
- For microservices organizations debugging complex, high-cardinality production behavior: Honeycomb offers the fastest exploratory query workflows for isolating rare multi-dimensional bottlenecks.
- For serverless and AWS-native workloads: Start with AWS X-Ray via OpenTelemetry instrumentation for immediate visibility across managed cloud services without running tracing infrastructure.
Regardless of which backend you select, instrument your services exclusively with OpenTelemetry SDKs and route traffic through an OpenTelemetry Collector—ensuring you can tune sampling policies, scrub sensitive attributes, and switch storage backends later without rewriting application code.
