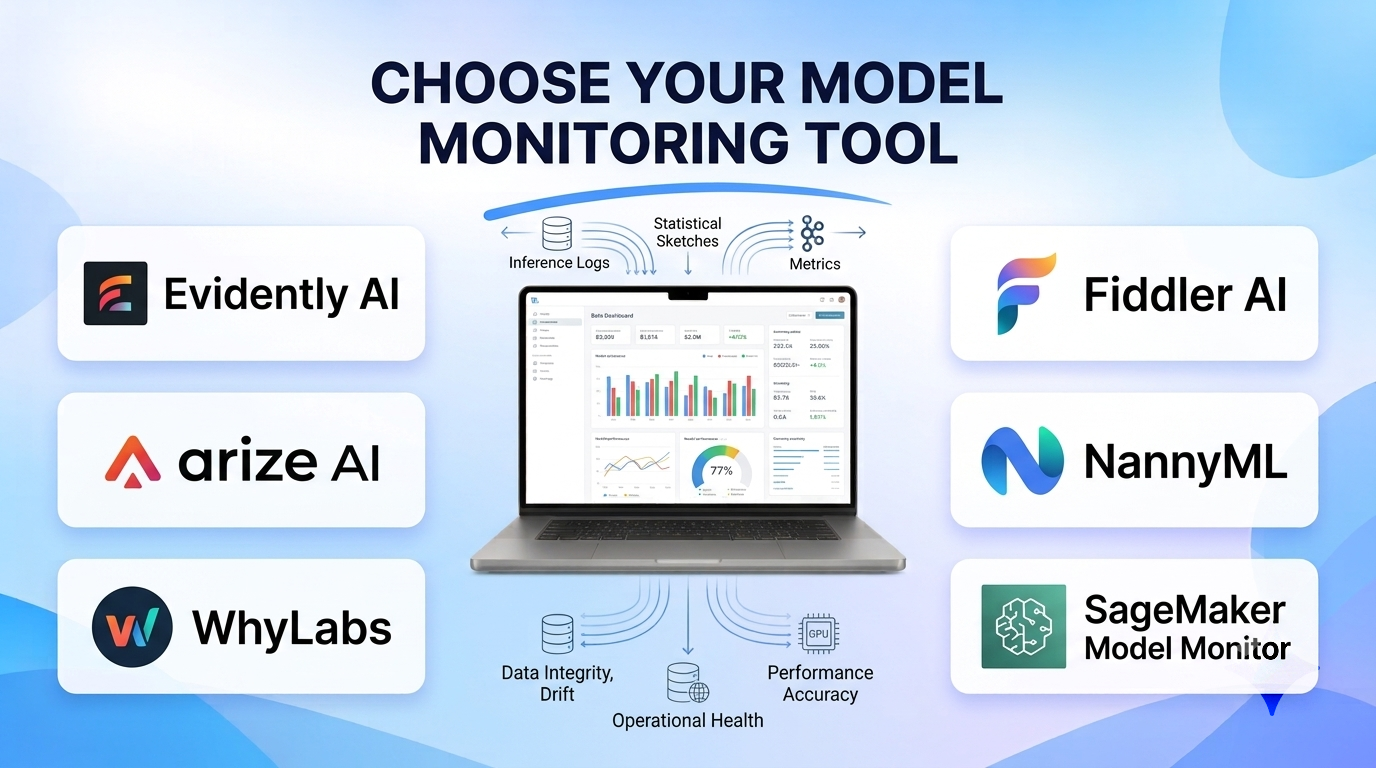
Unlike traditional software microservices that crash with clear HTTP 500 errors when a bug hits production, machine learning models degrade silently. A credit underwriting model continues returning valid probability scores even after inflation shifts borrower debt ratios; a recommendation engine keeps serving predictions at sub-20ms latency even after an upstream mobile app update breaks a user-location feature.
Model monitoring and drift detection tools act as the observability layer for production AI—tracking input feature distributions, prediction behavior, operational latency, and delayed ground-truth accuracy so data science teams catch silent model decay before it damages revenue or customer trust.
What Model Monitoring Actually Tracks: Three Distinct Signals
Effective ML observability separates infrastructure health from statistical and business degradation:
- Data Integrity and Schema Quality: Detecting missing values, unexpected null spikes, out-of-range numeric values, unseen categorical tokens, and training-serving feature skew at inference time.
- Statistical Drift (Covariate and Prediction Drift): Measuring shifts between baseline training distributions and live production traffic using statistical distance metrics—such as Population Stability Index (PSI), Kolmogorov-Smirnov (KS) tests, Jensen-Shannon divergence, and Wasserstein distance—even when ground-truth labels are unavailable.
- Ground-Truth Performance and Business KPIs: Joining logged predictions with delayed actual outcomes (such as whether a loan defaulted 90 days later or a user clicked an ad) to track real-world precision, recall, RMSE, calibration, and slice-level fairness.
Leading Model Monitoring and Drift Detection Tools Compared
Evidently AI
Evidently AI is one of the most popular open-source Python frameworks (paired with an optional commercial cloud platform) for evaluating, testing, and monitoring tabular, text, and LLM models. Evidently generates rich interactive HTML reports and JSON test suites covering data drift, target drift, classification/regression performance, and data quality checks with configurable statistical distance thresholds that integrate directly into Airflow, Prefect, or GitHub Actions pipelines.
Data science and ML engineering teams seeking transparent, customizable Python drift checks without immediate enterprise vendor contracts consistently adopt Evidently. Its open-source core operates primarily on batch data frames and logs rather than acting as a high-throughput streaming proxy, meaning real-time traffic must be logged to storage or sent to Evidently Cloud for continuous dashboards.
Arize AI (and Arize Phoenix)
Arize AI is an enterprise ML and LLM observability platform built to monitor both structured tabular/computer-vision models and modern generative AI applications at scale. Arize ingests production inference logs alongside baseline training datasets to visualize multi-dimensional drift, perform automated root-cause slice analysis (identifying specific customer segments, geographic regions, or device types driving accuracy drops), and trace LLM retrieval-augmented generation (RAG) spans via its open-source Arize Phoenix library.
Organizations running diverse production workloads—spanning classical tabular models, embeddings, and generative AI pipelines—value Arize’s unified root-cause slice troubleshooting and OpenTelemetry-native tracing. Because Arize is a specialized commercial observability SaaS (with VPC deployment options), smaller teams with only a handful of batch models may find its enterprise breadth heavier than necessary.
WhyLabs (and open-source whylogs)
WhyLabs takes a privacy-preserving, lightweight architectural approach built around its open-source whylogs telemetry library. Instead of shipping raw customer inference rows to an external monitoring server, whylogs computes compact, mergeable statistical profiles (approximate quantiles, histograms, cardinality sketches, and null counts) directly inside your inference container or batch job and streams only those lightweight metadata summaries to the WhyLabs platform.
Healthcare, financial services, and privacy-sensitive organizations gain a major compliance advantage because sensitive PII never leaves their runtime environment, and telemetry overhead remains tiny even at high inference throughput. Teams needing row-level replay or deep inspection of individual misclassified text/image records must still query their own internal data lake logs alongside WhyLabs profiles.
Fiddler AI
Fiddler AI combines production model monitoring with deep explainable AI (XAI) and AI governance diagnostics. Beyond tracking feature drift, data integrity, and operational latency, Fiddler computes feature attributions (such as Shapley values) on live production traffic to explain why predictions shifted, audits subpopulation fairness metrics across protected attributes, and monitors LLM hallucination and safety guardrails.
Regulated enterprises—particularly financial institutions, insurers, and healthcare providers subject to model risk management and algorithmic fairness audits—derive strong governance value from Fiddler’s explainability-centric monitoring. Its enterprise platform positioning makes it better suited for mature AI governance programs than early-stage startups.
NannyML
NannyML is an open-source Python library (with a commercial SaaS offering) engineered specifically to solve one of production ML’s hardest problems: estimating model performance when ground-truth labels are delayed or completely unavailable. Using algorithms such as Confidence-Based Performance Estimation (CBPE) and Direct Loss Estimation (DLE), NannyML estimates future precision, recall, ROC AUC, or regression error solely from live model inputs and prediction confidence scores, while also offering multivariate PCA-based reconstruction error drift detection to avoid false-positive univariate alerts.
Teams working in domains with long feedback loops—such as credit underwriting, fraud chargebacks, customer churn, and predictive maintenance where true outcomes take weeks or months to arrive—gain unique operational value from NannyML’s label-free performance estimation. Like other Python-first libraries, teams must wire batch log ingestion and alerting into their own orchestrator unless using NannyML Cloud.
AWS SageMaker Model Monitor & GCP Vertex AI Model Monitoring
Cloud hyperscalers embed native drift detection directly inside their managed inference endpoints. Amazon SageMaker Model Monitor captures endpoint request/response payloads to S3 automatically, compares live statistics against baseline constraints via scheduled processing jobs, and emits CloudWatch alerts for data quality, model quality, bias drift, and feature attribution drift. Vertex AI Model Monitoring similarly monitors feature skew (training vs. serving) and prediction drift directly on Vertex Endpoints.
Teams already hosting real-time inference endpoints on SageMaker or Vertex AI benefit from zero-integration log capture and unified cloud billing. Their primary limitation is portability: neither tool monitors models hosted outside its respective cloud ecosystem cleanly.
Great Expectations and Soda (Data-Layer Drift Guardrails)
While built primarily for data engineering quality rather than ML-specific metrics, Great Expectations and Soda frequently serve as the first line of defense in ML pipelines. By validating upstream feature tables for schema changes, null thresholds, and distribution shifts before batch inference or retraining runs, they prevent broken upstream ETL jobs from poisoning models.
Model Monitoring Tool Comparison
| Platform | Core Architecture | Specialty Strength | Privacy & Data Footprint | Best Fit | Key Trade-Off |
| Evidently AI | Open-source Python library + Cloud SaaS | Comprehensive drift/quality test suites and HTML reports | Runs locally in Python or logs to Evidently Cloud | Python ML teams embedding drift checks into CI/CD and batch jobs | Streaming real-time alerts require external log ingestion setup |
| Arize AI | Enterprise ML & LLM observability SaaS/VPC | Automated slice-level root-cause analysis + Phoenix LLM tracing | Ingests inference logs/embeddings to Arize plane | Enterprises scaling both tabular ML and LLM applications | Commercial enterprise pricing; heavy for small batch setups |
| WhyLabs (whylogs) | Edge-computed statistical telemetry profiles | Zero raw-data egress; tiny runtime overhead at high scale | Only statistical sketches leave runtime; PII stays local | Regulated/privacy-first industries and high-QPS inference | Row-level payload debugging requires separate internal storage |
| Fiddler AI | Explainability-led AI observability & governance | Production SHAP attributions, fairness audits, and LLM guardrails | Cloud SaaS or VPC deployment | Banks, insurers, and regulated governance programs | Enterprise-oriented setup and commercial structure |
| NannyML | Open-source Python + Cloud SaaS | Estimating real-world accuracy without ground-truth labels | Runs locally on logged dataframes or NannyML Cloud | Use cases with delayed labels (credit, churn, fraud, maintenance) | Relies on well-calibrated prediction probabilities for CBPE |
| SageMaker / Vertex Monitor | Cloud-native endpoint payload monitoring | Turnkey integration with managed cloud endpoints and alerts | Stays inside AWS S3/CloudWatch or GCP storage | Teams already deploying endpoints natively on AWS or GCP | Locked to single-cloud managed inference endpoints |
Four Common Mistakes in Production Model Monitoring
- Alerting on Every Univariate Drift Metric: In a model with 200 features, minor statistical fluctuations will trigger false-positive KS or PSI alerts every day—causing engineers to ignore alerts entirely. Prioritize drift alerts on the top 10–15 highest-importance features or use multivariate drift detection.
- Confusing Input Drift with Performance Drop: A feature distribution can shift without hurting accuracy if the model generalizes well across that region, while subtle shifts in feature interactions can ruin accuracy without triggering univariate alerts. Always combine drift metrics with delayed ground-truth tracking wherever labels eventually arrive.
- Forgetting Training-Serving Skew Checks: Log the exact feature vector seen by the model at inference time—not just raw API request JSON—so you verify that online feature transformations match offline training tables.
- Monitoring Models Without an Action Playbook: An alert is useless unless tied to a clear remediation path: automated retraining triggers, fallback heuristic rules, or human-in-the-loop review queues.
Choosing the Right Monitoring Strategy
Start simple and scale instrumentation with business risk. If your models run in scheduled batch pipelines, embedding open-source Evidently AI or NannyML (particularly when ground-truth outcomes arrive weeks late) into your orchestrator catches data and drift issues immediately at zero licensing cost. Teams serving real-time endpoints on AWS or Google Cloud can enable SageMaker Model Monitor or Vertex AI Model Monitoring for fast baseline coverage. Finally, enterprises operating dozens of high-stakes models across regulated domains or combining tabular ML with generative AI gain deep root-cause slice diagnostics, privacy-safe telemetry, and governance reporting from Arize AI, WhyLabs, or Fiddler AI.
